
At the core of the HousingAlerts system is the Market Summary Report (formerly the "Summary Market Scoring Report"). It's a separate one-page report for each market in your package.
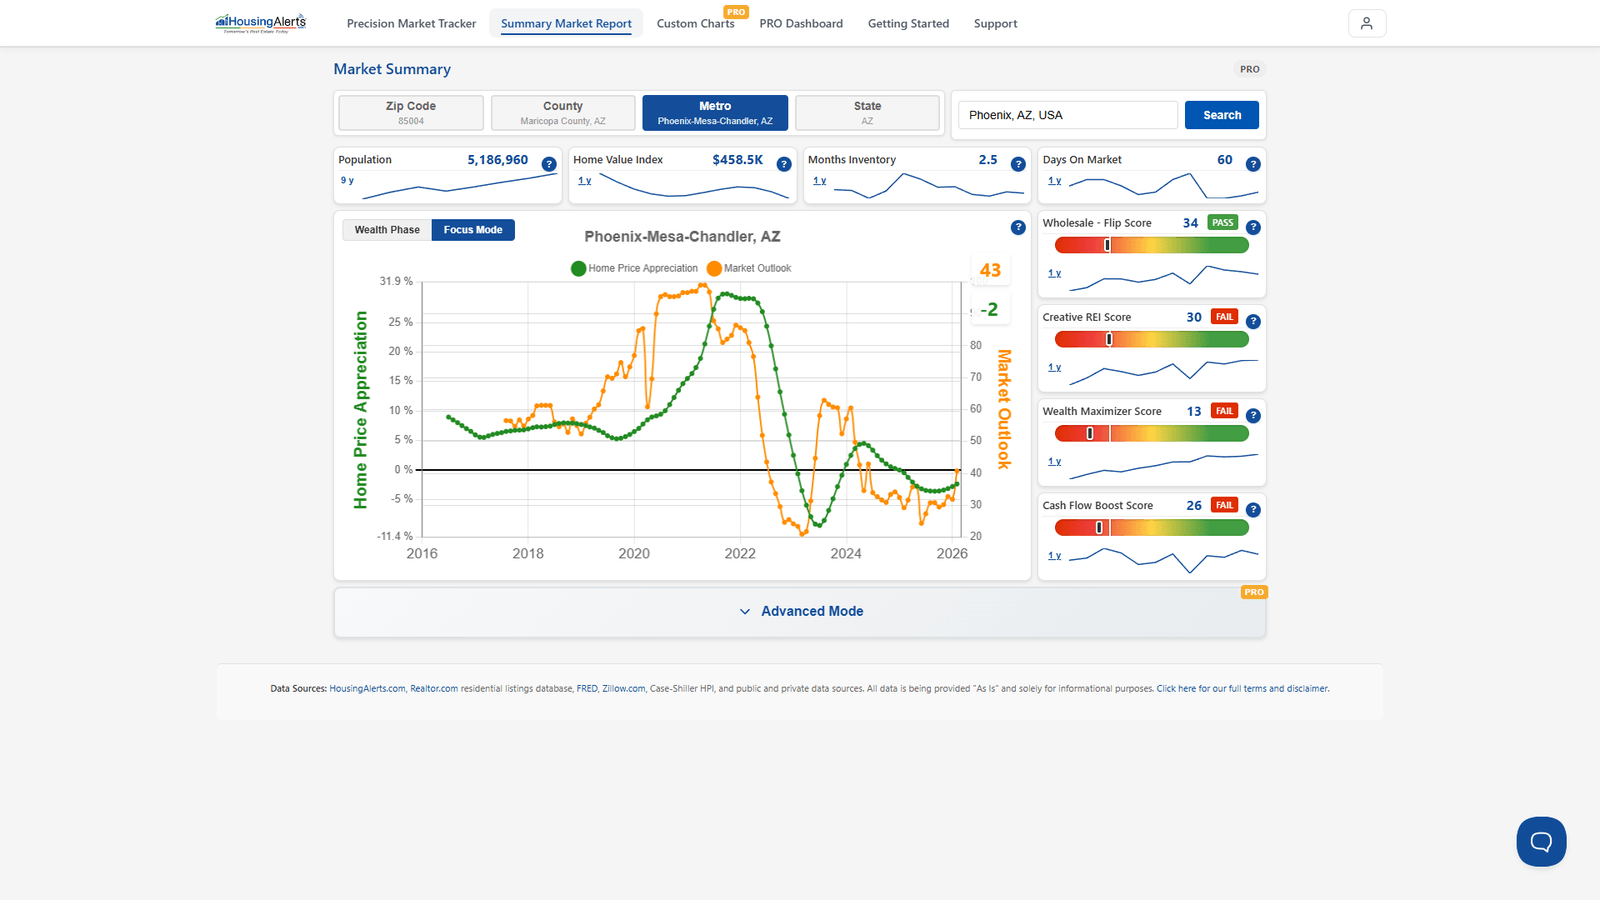
In this guide we cover the Market Rankings Gauges, the S.T.A.R. Momentum indicators, the T.A.P.S. scores, and the Wealth Phase charts. On the new platform the top of the report shows the Market Outlook chart, the headline tiles, and the strategy scores; open Advanced Mode to reveal the ranking gauges and the S.T.A.R./T.A.P.S. detail.
Market Rankings Gauges (Advanced Mode)
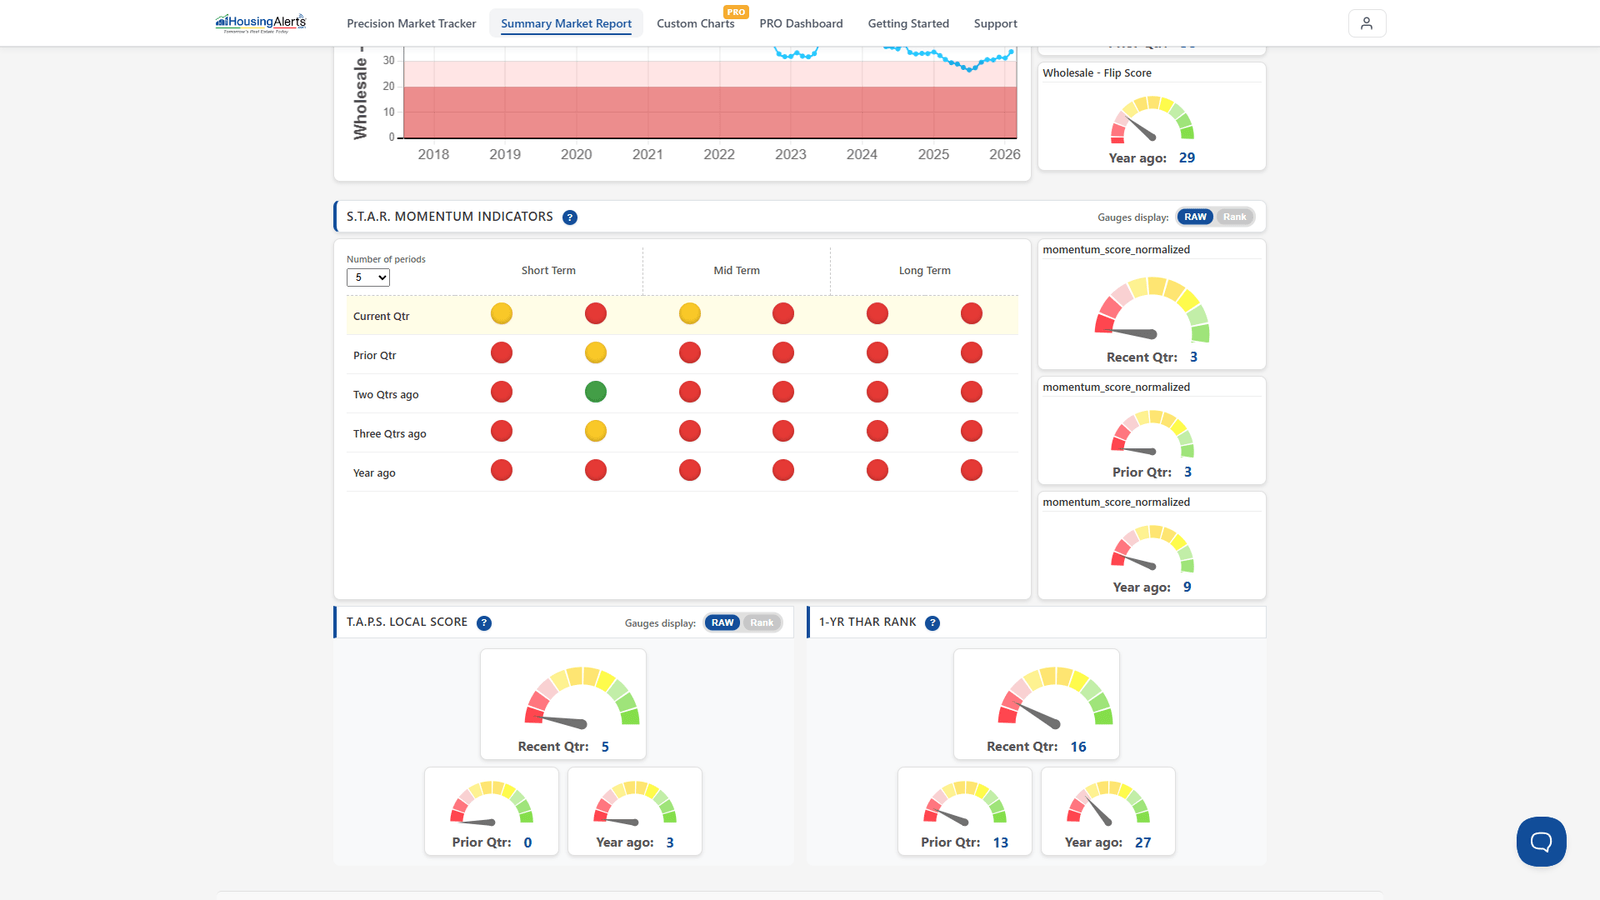
An easy way to spot the hottest markets is to look for those scoring in the highest percentiles versus all other markets. A score of "90" means the market ranks higher than 90% of all markets for that criterion. In Advanced Mode you'll find these gauges:
- Market Outlook Score (formerly Master Score) — the best single indicator if you only want ONE number. A proprietary algorithm that integrates all of the underlying data (including T.A.P.S. and S.T.A.R.) into a single forward-looking score.
- T.A.P.S. Combined Score — the Technical Analysis Point Score after combining the local (city-level) market with its State, Regional and National T.A.P.S. scores.
- T.A.P.S. Local Score — the T.A.P.S. ranking for that particular city ONLY, ignoring any State/Regional/National influence.
- Momentum Score (S.T.A.R.) — uses the S.T.A.R. indicator to measure and rank each market by its momentum.
- 1-Yr THAR — ranks markets by their raw Total Home Appreciation Rate over the previous year.
- 4-Yr THAR — ranks markets by their raw Total Home Appreciation Rate over the previous four years.
S.T.A.R. Momentum Indicators and T.A.P.S.
All of the training in the S.T.A.R. & T.A.P.S. material applies to the S.T.A.R. Momentum Indicators (the Green / Yellow / Red circles, shown Short / Mid / Long Term across the last five quarters) and the T.A.P.S. Local Score gauges in the report's Advanced Mode. Read the two together — momentum (S.T.A.R.) and strength (T.A.P.S.) are independent variables and don't always agree.
Wealth Phase Charts – Buy/Sell Indicators
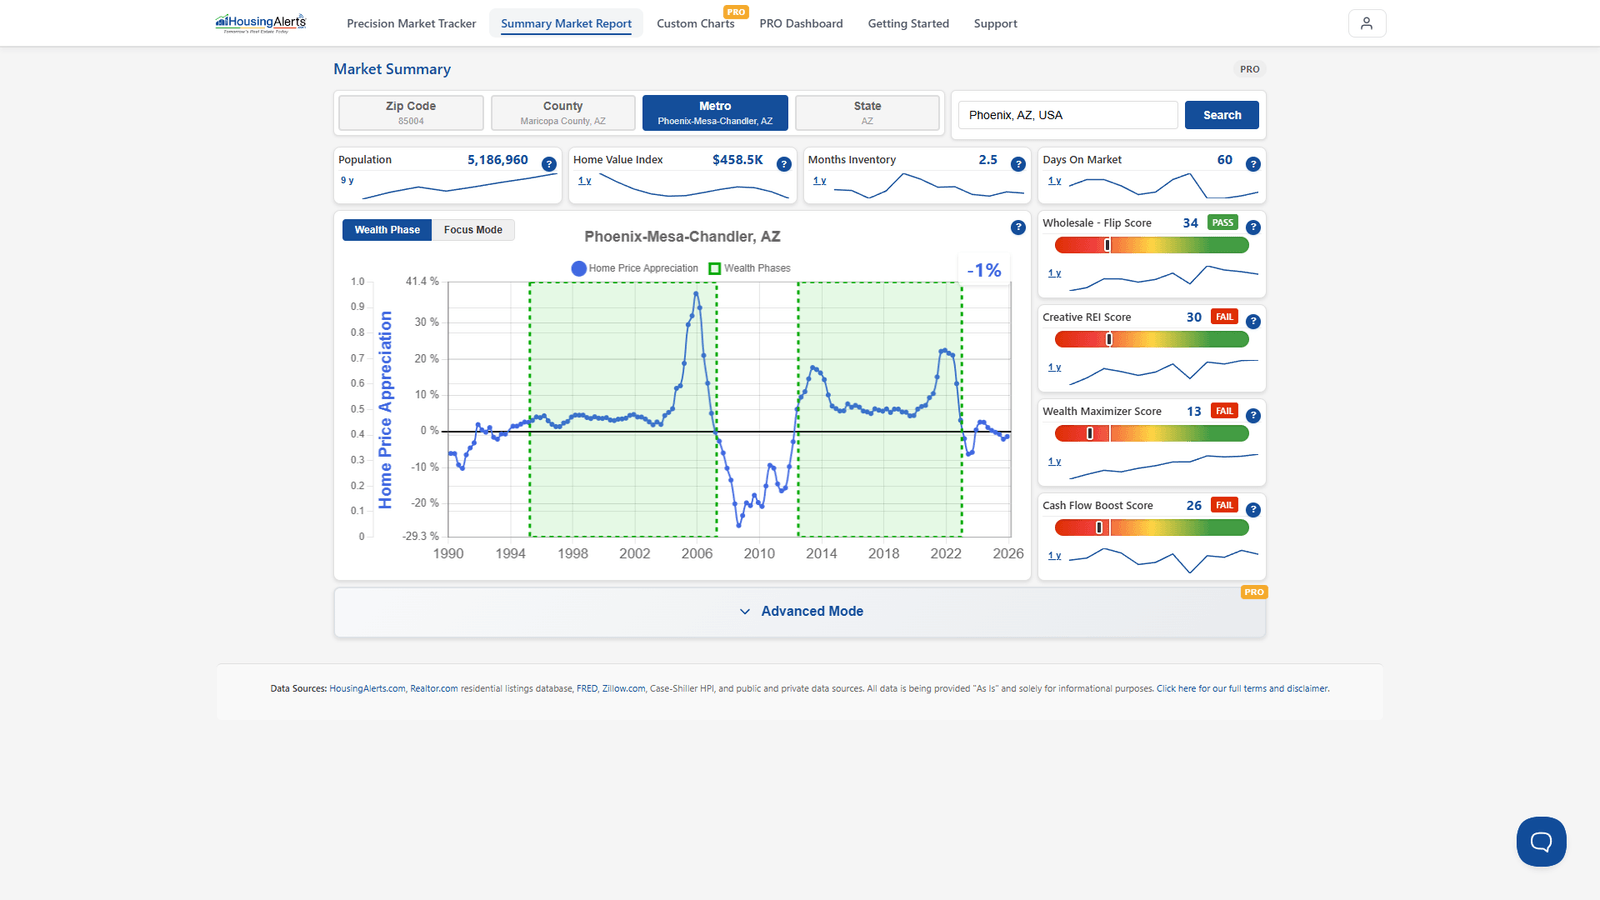
This Q&A between Ken and a member helps explain when the indicators signal a buy or sell.
Question:
During the wealth building phase chart while it shows green, but starts its decline, is this the time to sell or is it better to wait until the green phase ends and it starts to dip below the line? As I understand from the video tutorial, the market is still increasing during the entire phase of the green above the line part, but that it can be difficult to sell as the green phase is ending.
Answer:
You are correct: so long as the blue line is above the 'zero' line, the market is appreciating.
Once you're already invested, because of the transaction cost and effort to sell, I don't get too concerned about minor up/down gyrations in the blue line so long as the T.A.P.S. indicators show at least neutral-or-better strength and the S.T.A.R. long-term indicators are green.
I personally view the END of the Wealth Cycle as the "FINAL" confirmation indicator to sell (assuming you're a "Local Market Master" and aren't looking to invest in other hot, emerging markets).
Usually, long before the Wealth Phase ends, the S.T.A.R. and T.A.P.S. tools BOTH start showing signs of weakening. Depending on your risk profile, market concentration/diversification, and what's happening in nearby markets, you may not want to wait until the Wealth Phase chart ends.
If you're not 'stuck' in a single market, WHEN you leave is more a question of opportunity cost than milking a single market for the last bits of appreciation. As a market accumulates more red S.T.A.R. icons (losing momentum) AND its T.A.P.S. scores keep weakening, the risk of decline is rising and the odds of big appreciation are falling — the risk/reward trade-off is no longer as strong.
As a "Total Market Master" riding appreciation waves from one market to the next, focus more on The Table (ranking your markets relative to all others nationwide) than on any single Wealth Phase chart, so you can jump into new emerging markets that may offer higher appreciation at lower risk.
Wealth Phase Charts – Moving-Average lines
The moving-average lines are used mainly to determine a market's momentum. The S.T.A.R. indicator (the red/yellow/green traffic-light icons) was designed to interpret the chart and its moving-average lines for you, so you don't have to become a chart-reading expert — the S.T.A.R. icons and the MA lines are largely one and the same.
We analyze a market on two important, independent variables:
- Momentum — the red / yellow / green S.T.A.R. traffic-signal icons.
- Technical Score — the T.A.P.S. gauges.
When ENTERING a new market, you want to see BOTH strong S.T.A.R. momentum (lots of green, especially Intermediate and Long Term) and strong T.A.P.S. scores — that combination makes it less likely the market rolls over any time soon.
Rough importance ranking when ENTERING a market:
- Wealth Phase
- Market Outlook Score
- S.T.A.R. Momentum
- T.A.P.S. Combined
- T.A.P.S. Local
- 1-Yr THAR
- 4-Yr THAR
Once you're already invested, because of the cost/effort to exit, S.T.A.R. matters less except as an early-warning indicator.
Rough importance ranking when EXITING a market:
- Wealth Phase
- T.A.P.S. Local
- 1-Yr THAR
- Market Outlook Score
- T.A.P.S. Combined
- S.T.A.R. Momentum
- 4-Yr THAR
(The above assumes you're a Local Market Master focused on a single market. If you're not stuck in one market, when to leave is again more about opportunity cost.)