
The Green, Red, and Yellow icons in the S.T.A.R. (Six Trigger Alert Report) represent the status of the six Technical Analysis (TA) decision triggers, for each quarter:
- Green — the market is trending ABOVE that trigger for that period.
- Red — the market is trending BELOW that trigger for that period.
- Yellow — the market activated that trigger in the current period.
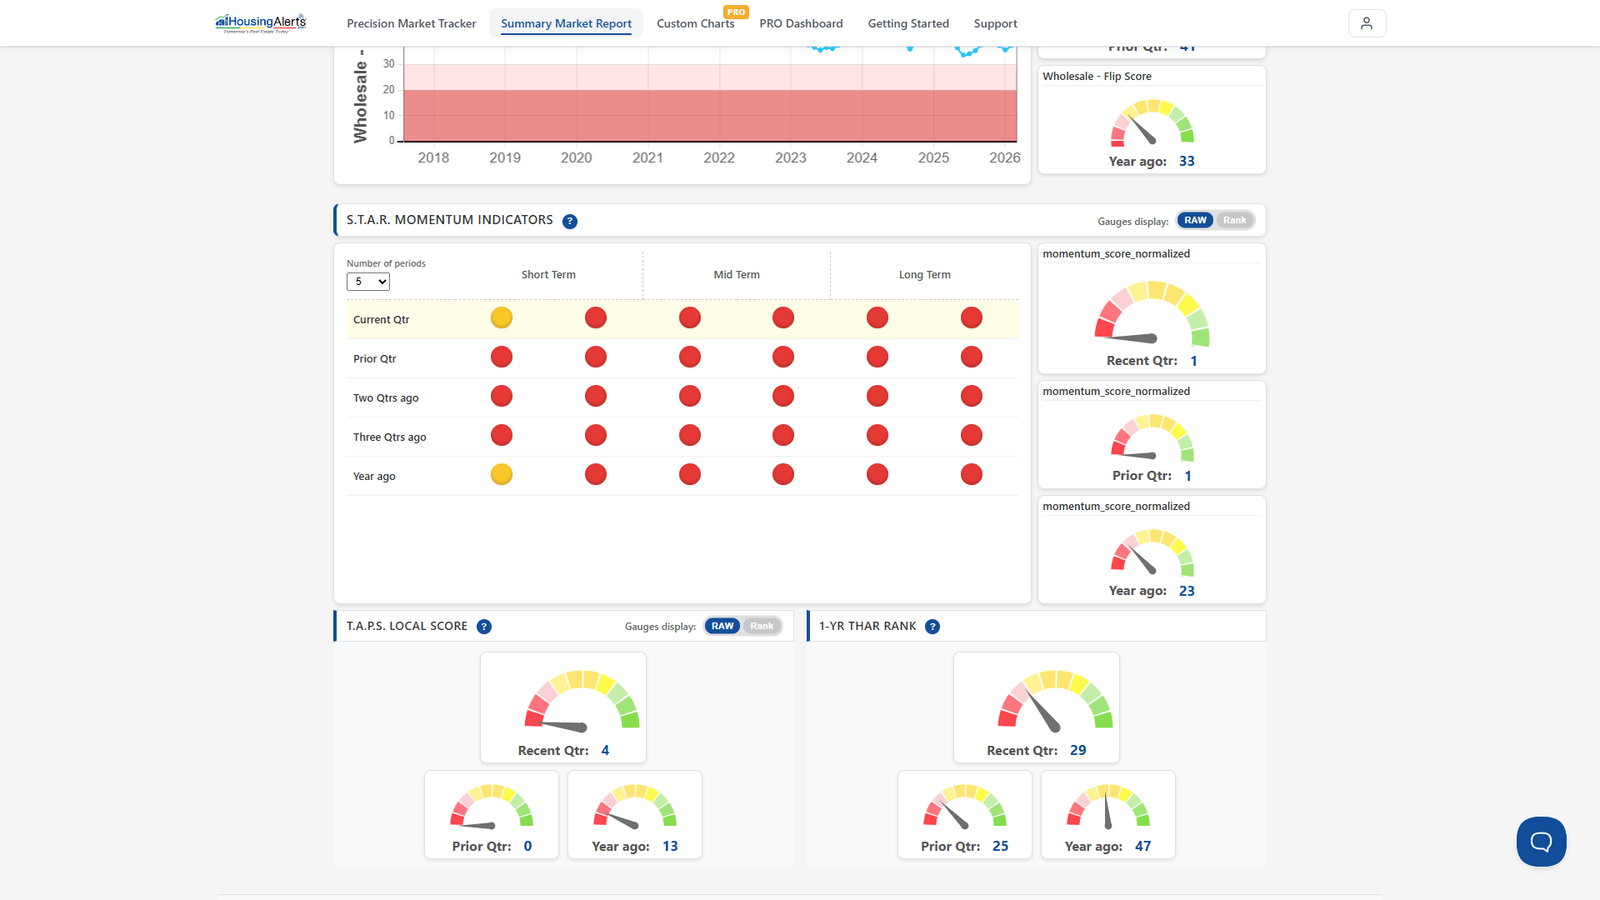
This is very accurate for identifying strong trends (up or down). But because it's a pure trend finder, it doesn't always account for the current state of appreciation or depreciation — it only looks at trends. That's why S.T.A.R. is always read together with the T.A.P.S. strength score (the slider/gauge) and the market's ranking. Generally, the markets at the top of a ranked list are appreciating the fastest.
On the new platform, rank markets in The Table (by the Market Outlook Score, which blends these signals), then open a market's Market Summary Report → Advanced Mode to see its S.T.A.R. circles and T.A.P.S. gauges side by side.