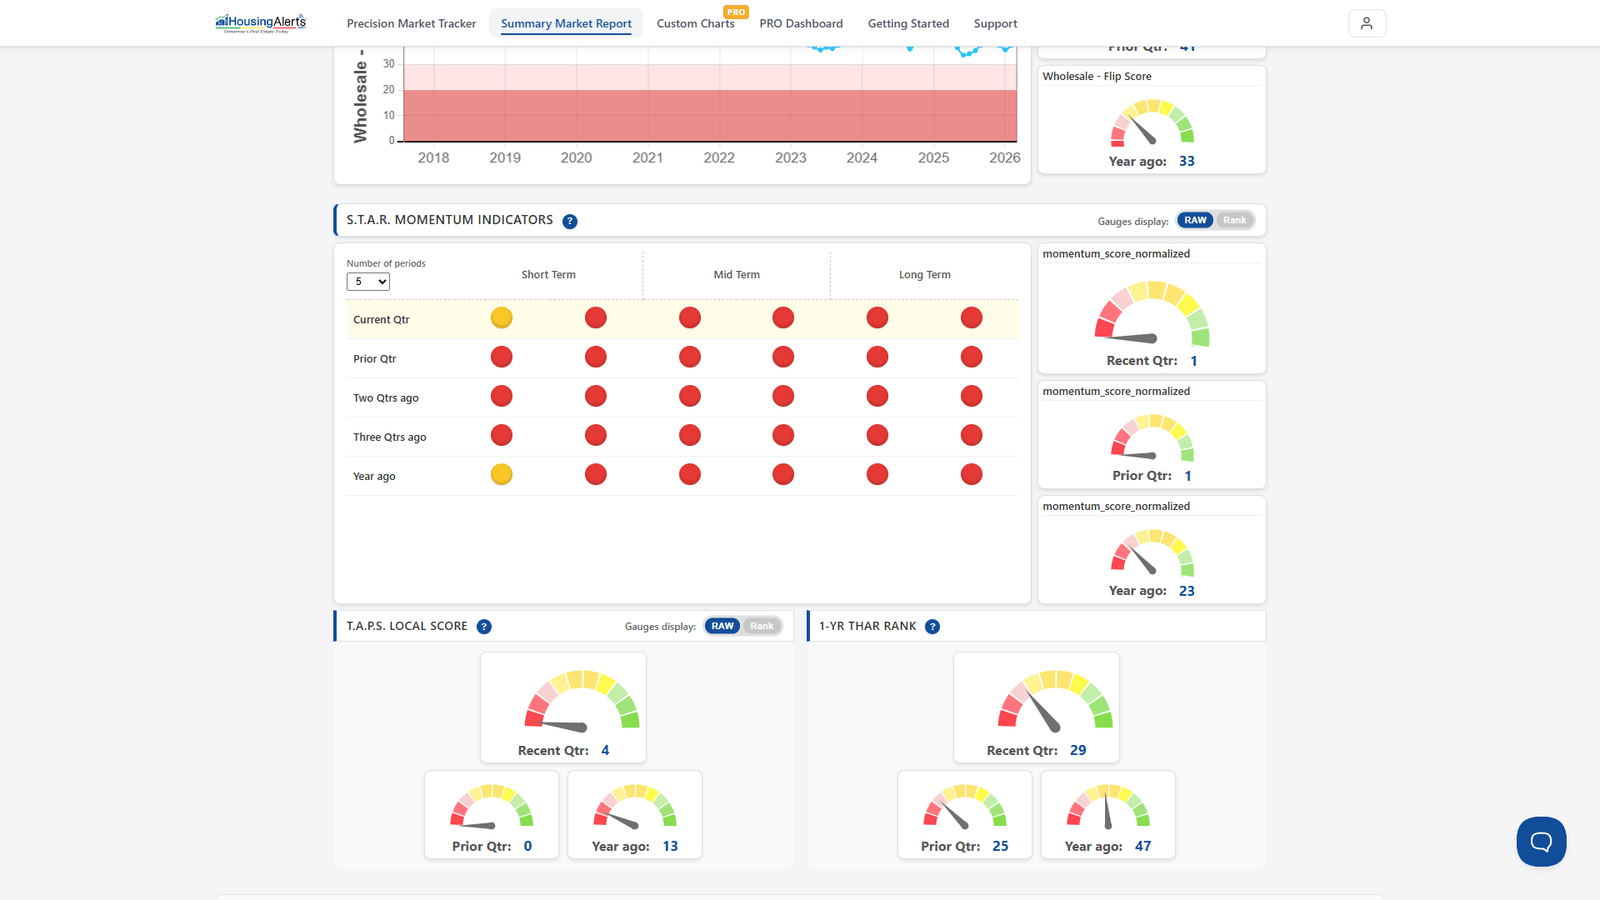
On the old Market Scoring Report, this was the difference between the Moving Average Trend Analysis (Inflation Adjusted) chart and the (TECH) version. Of all the charts and tables we use to calculate a local market's scores, this is the most important chart of all — and we use it for two completely different calculations:
- To determine that market's appreciation / profitability levels.
- To determine that market's "technicals" / momentum (this is the chart labeled "TECH").
The key insight: a market can have very strong momentum/technicals simply by being 'less bad' each period. For example, if a market declined 20% a year ago, 15% three quarters ago, 10% two quarters ago, and 5% last quarter, it has very strong upward momentum — even though it's still declining on an inflation-adjusted basis. That market would show an increasing number of S.T.A.R. icons turning from red/yellow to green.
Separate from momentum is the market's actual performance level. In that example the market was still declining despite strong momentum. So we apply a different set of algorithms to the same chart to score actual performance/appreciation. Using that example, the market would show a 'weak' slider for performance but a 'strong' slider for momentum.
On the new platform, this two-sided read shows up as the distinction between the appreciation indicators (performance) and the S.T.A.R. Momentum grid (momentum) in the Market Summary Report → Advanced Mode — and you can chart the underlying inflation-adjusted series in Custom Charts PRO.