
Inflation-Adjusted Home Price Index — an "index" is an easy way to compare different markets over time cumulatively (rather than annually or quarterly), relative to each other.
An index takes a starting year (any year), calls its home-price level the base year (say, "100"), and then expresses every other year relative to that base. So when comparing markets with very different absolute prices (say Detroit vs. San Francisco), the index simply compares the relative change each market has experienced. Index values are especially helpful for showing cumulative changes and the compounding effect over many years — with inflation stripped out here so the comparison reflects real Supply & Demand.
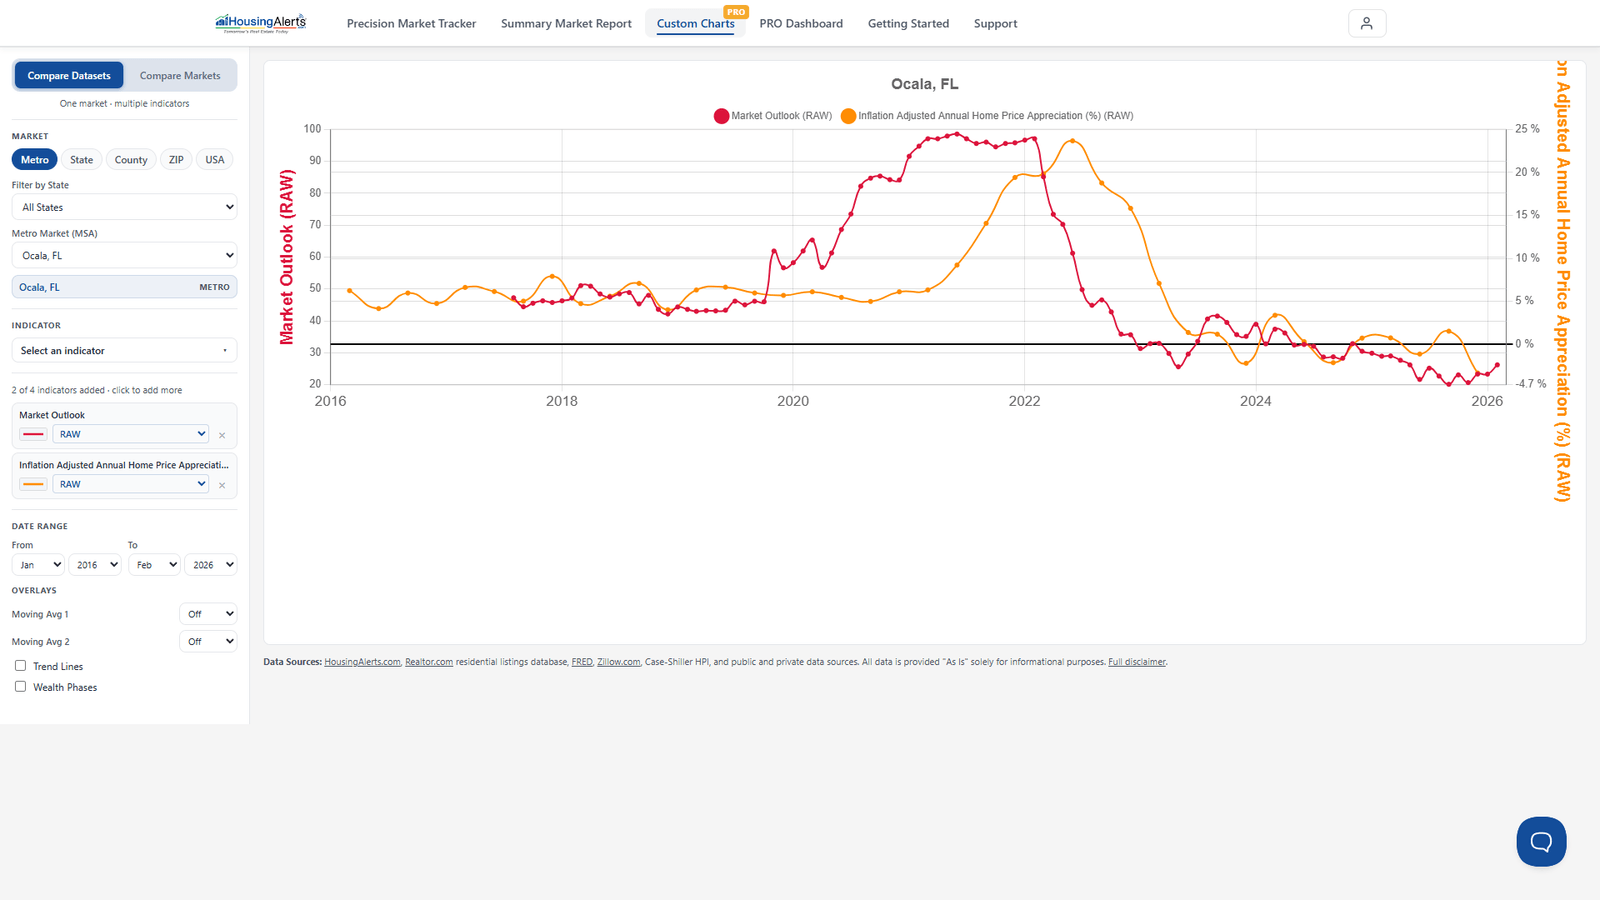
On the new platform, chart this in Custom Charts PRO to compare a market's cumulative, inflation-adjusted price path over time (and overlay a second market or indicator to compare).