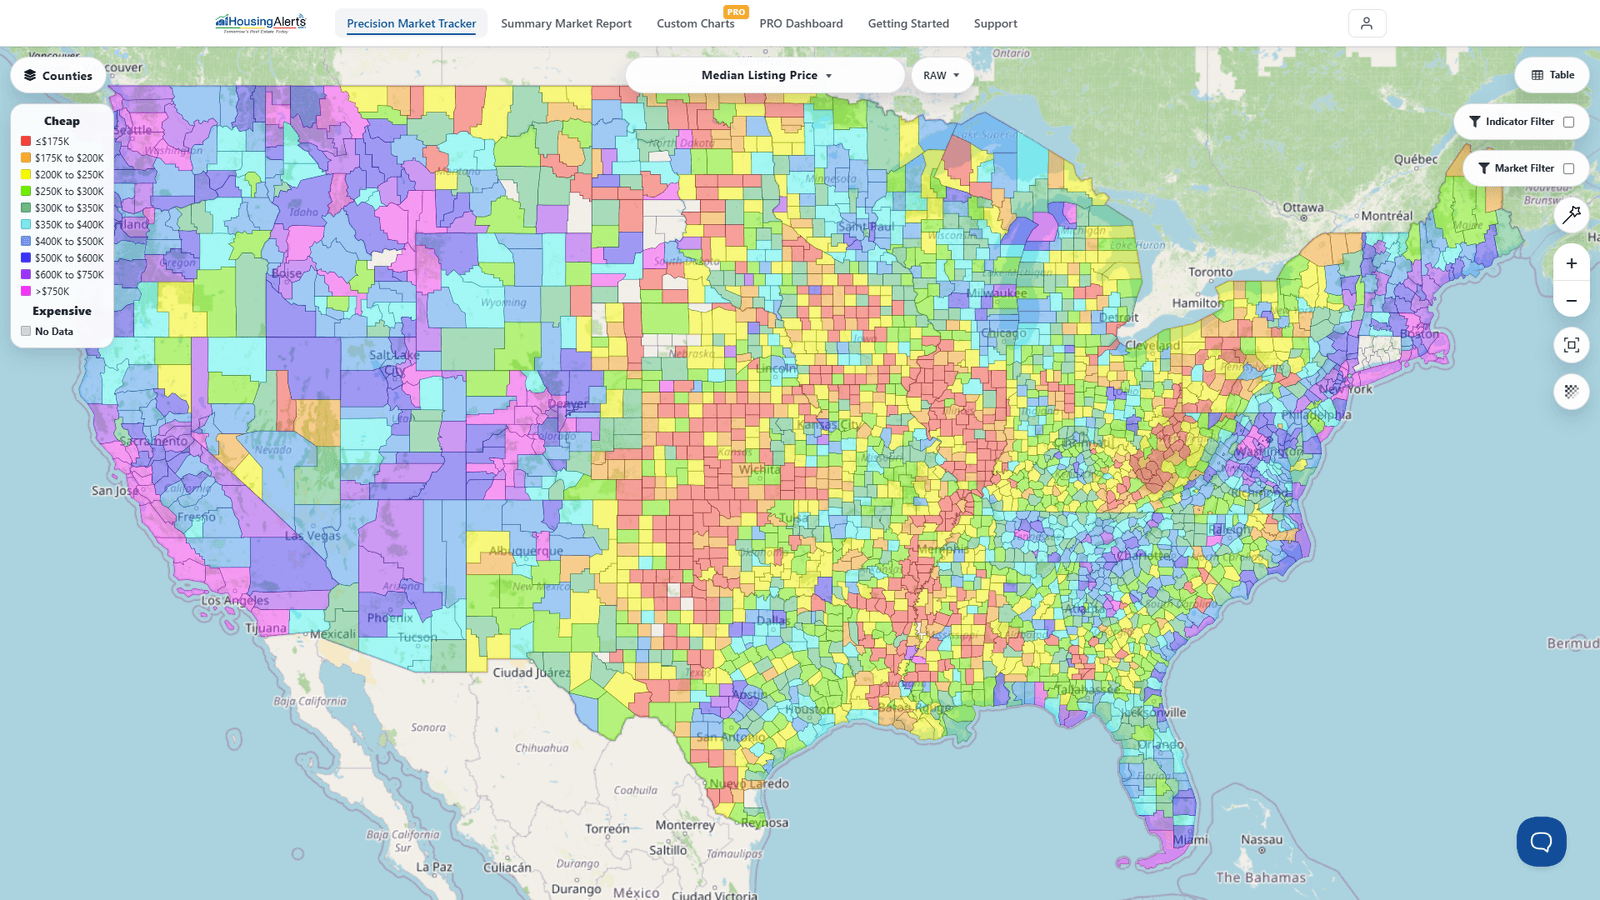
HousingAlerts tracks over 30,000 distinct markets across the United States, at every geographic level:
- ✅ 50+ states
- ✅ 410 metro (MSA) markets
- ✅ 3,100+ counties
- ✅ 27,000+ ZIP codes
Plus neighborhood-level micro-markets within those. You move between all four levels — States, Metro, Counties, ZIP Codes — with the market-level selector at the top-left of the Map (and the Table).
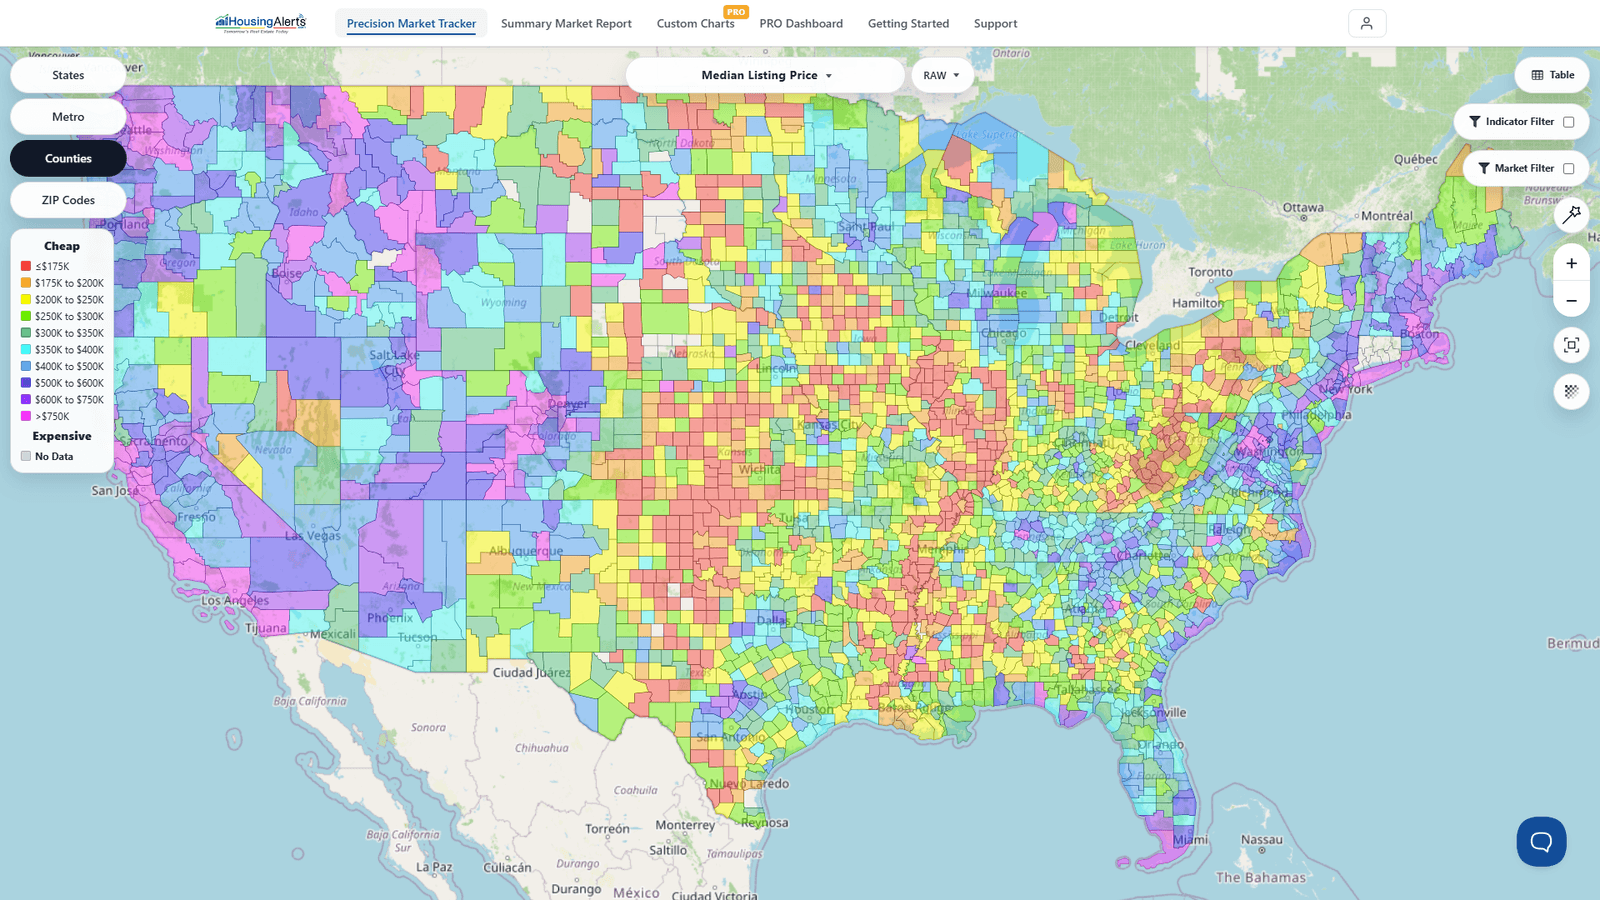
Wherever a deal lands, you can put "headlights" on that market in seconds — see its color on the national heatmap, rank it against every other market in the Table, or pull a full Market Summary Report on it.
Note: The exact number of covered ZIP codes and micro-markets grows over time and can vary slightly by data update. The figures above reflect the platform's current nationwide coverage.