
Although the raw data tracks single-family homes, there is a very strong correlation to the multi-family market.
It depends on how many units per property you're talking about. Two- to four-unit projects track the single-family market very closely. When you get up to 200-unit apartment buildings, the tightness of the correlation starts to diminish.
In general, though, a "strong" market is strong across the board — and vice-versa. Even large multi-family projects in a market with an ugly residential picture (say, Flint, MI as an example) don't show much upside, because the residential market there is so weak.
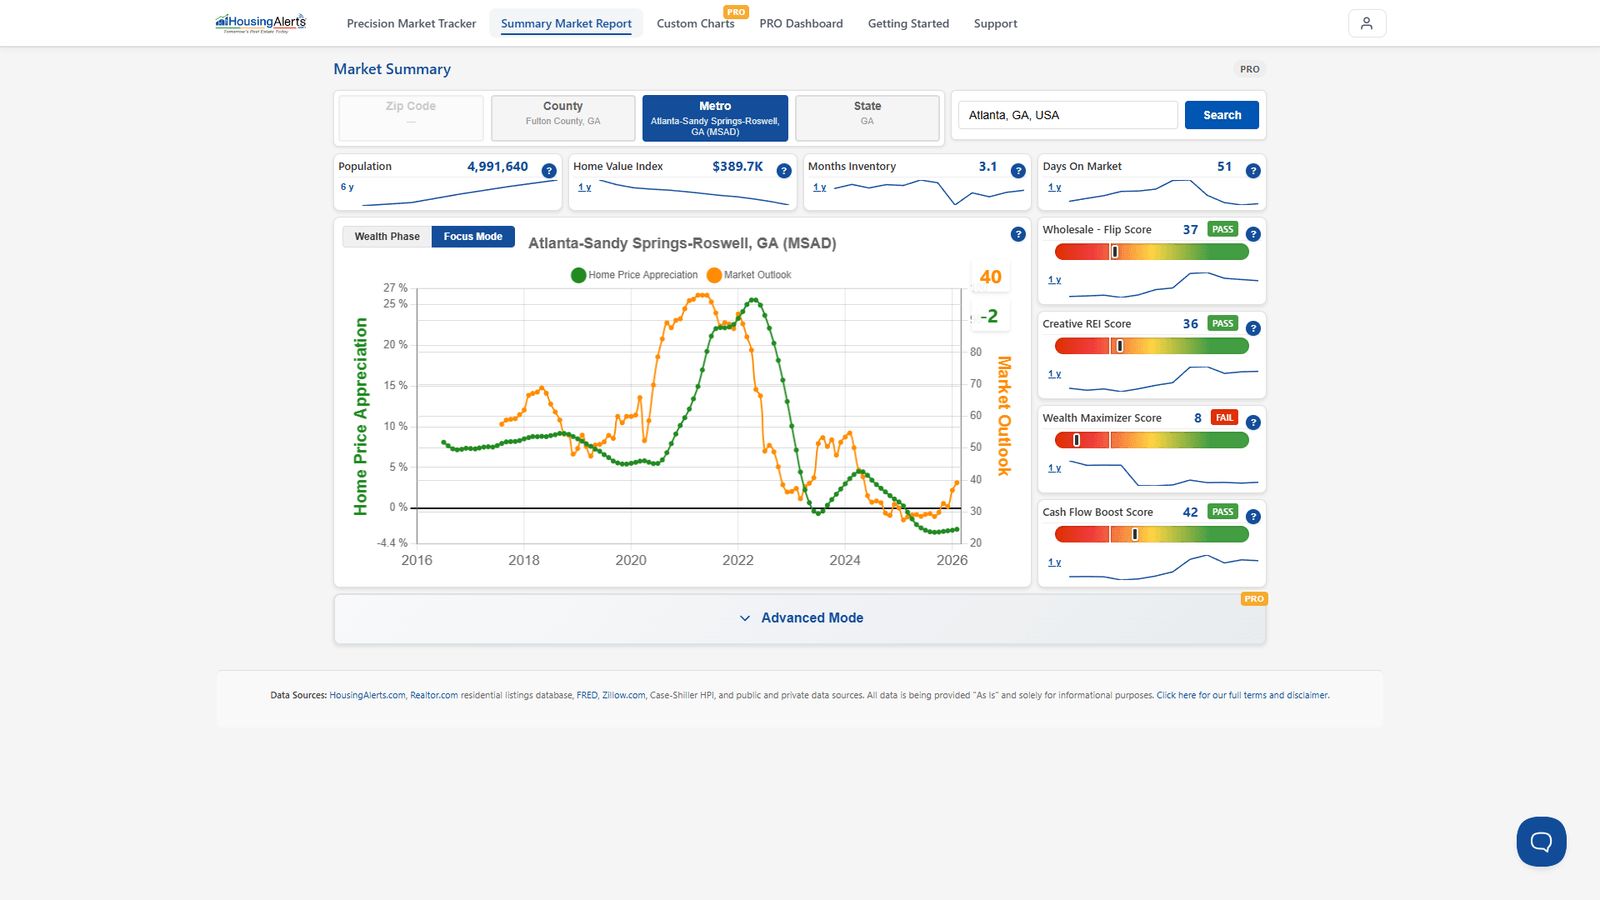
The important point is to invest where "automatic appreciation" increases your upside and reduces your risk. If the residential market is crashing, it's unlikely any sub-group is performing well — you're better off looking elsewhere for lower risk and higher potential upside.
On the new platform, gauge a market's residential strength with the Market Outlook Score (Map/Table) and the Wealth Phase (Market Summary Report), and use it to judge the relevance/upside for your multi-family or commercial play.