
This capability is unprecedented in the REI industry for 3 big reasons:
- You can find the median home value for any county or ZIP code with the click of a mouse.
- You can find HOT appreciating markets that also have the lowest-cost properties.
- You can price your deals better than competing investors in any market.
The old standalone "House Value Finder" combined each market's home value with its hot-market score. On the new platform you get the same result inside the Precision Market Tracker using the Home Value Index (and the Median Listing Price indicator) together with the Market Outlook Score.
What changed: the old House Value Finder (Hot Market Score + House Value) is now the Home Value Index shown on every Market Summary Report, plus value indicators (like Median Listing Price) you can rank markets by in The Table. "Save Selection to My Market Tracker" is the legacy watchlist (see Create A Watchlist).
Finding low-cost, hot markets
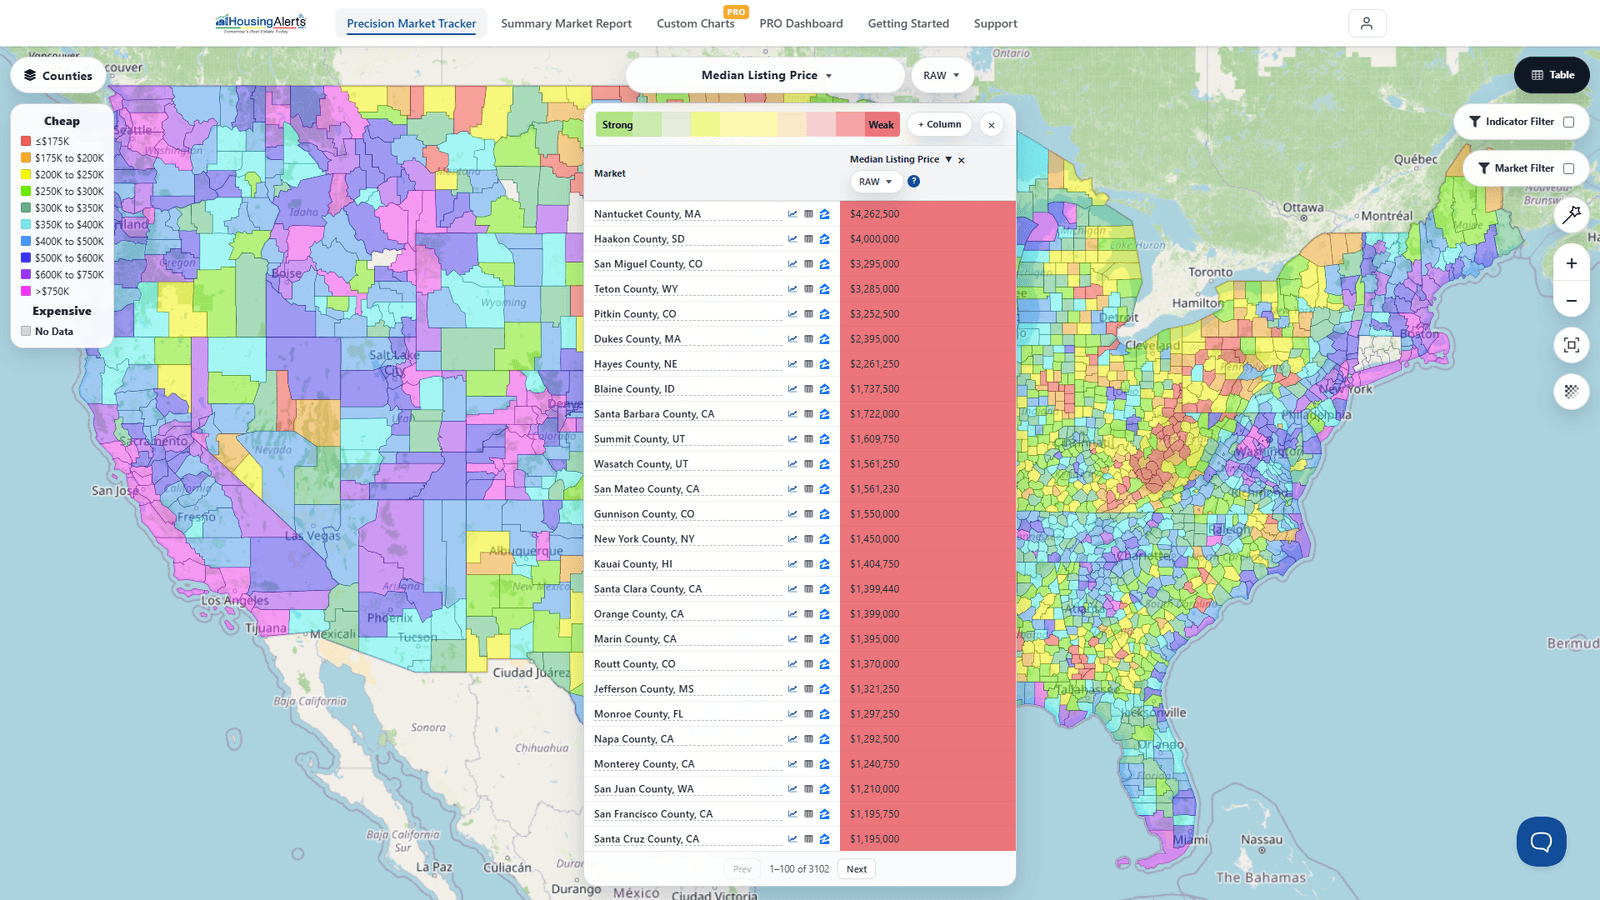
- In the Precision Market Tracker, choose a value indicator in the dataset picker (e.g. Median Listing Price under MLS Indicators) and open The Table to rank every market by price.
- Set the geography level (County or ZIP) to find value at the micro-market level.
- Sort by value, lowest to highest (click the column header; the blue arrow reverses order) to surface the cheapest markets.
- Add the Market Outlook column with + Column so you can see, side by side, which of those cheap markets also have strong appreciation potential.
The markets that are both among the cheapest and show a strong (or fast-rising) Market Outlook are your goldmines — the lowest-cost properties in the U.S. that sit in hot, thriving markets. You no longer have to compile heaps of data to uncover them; the platform does it for you.
Reading value for a single market
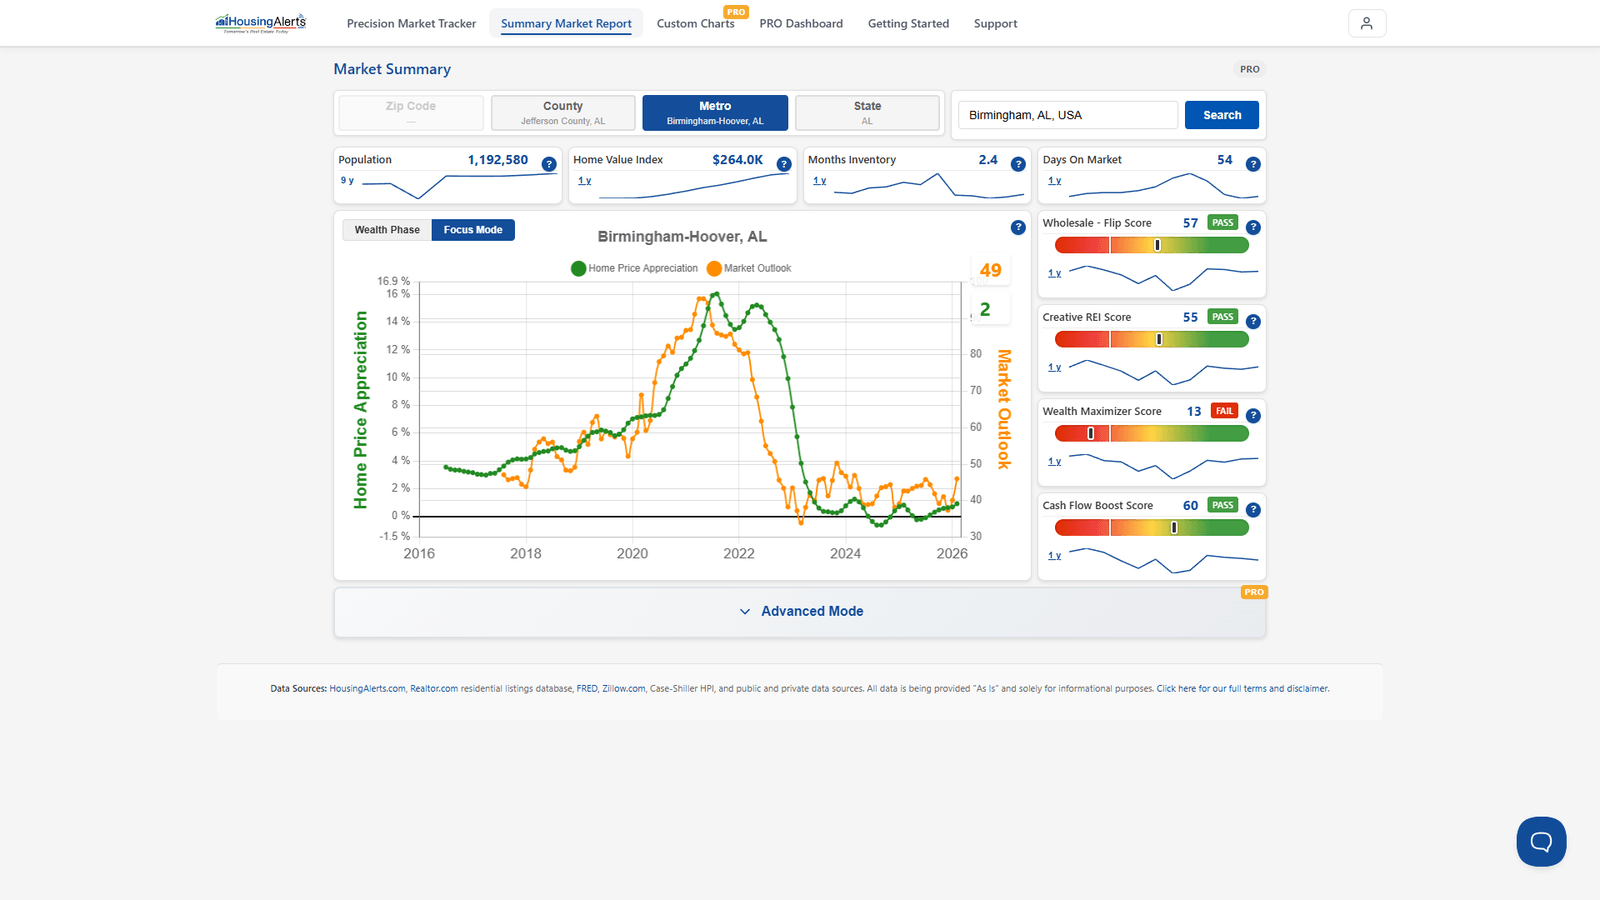
Open any market's Market Summary Report: the Home Value Index tile shows that market's estimated median home value at the chosen level (Metro, County, or ZIP), right beside the Market Outlook and the strategy scores. That's your baseline pricing index — you'll know roughly what homes should be selling for before you invest, and you can price your offers more sharply than competitors.