
Inflation-Adjusted Quarterly Home Price Appreciation (%) is the same as Quarterly Home Price Appreciation (annualized %), except that it excludes the effects of general inflation — so you see the true Supply & Demand movement rather than a number partly driven by inflation.
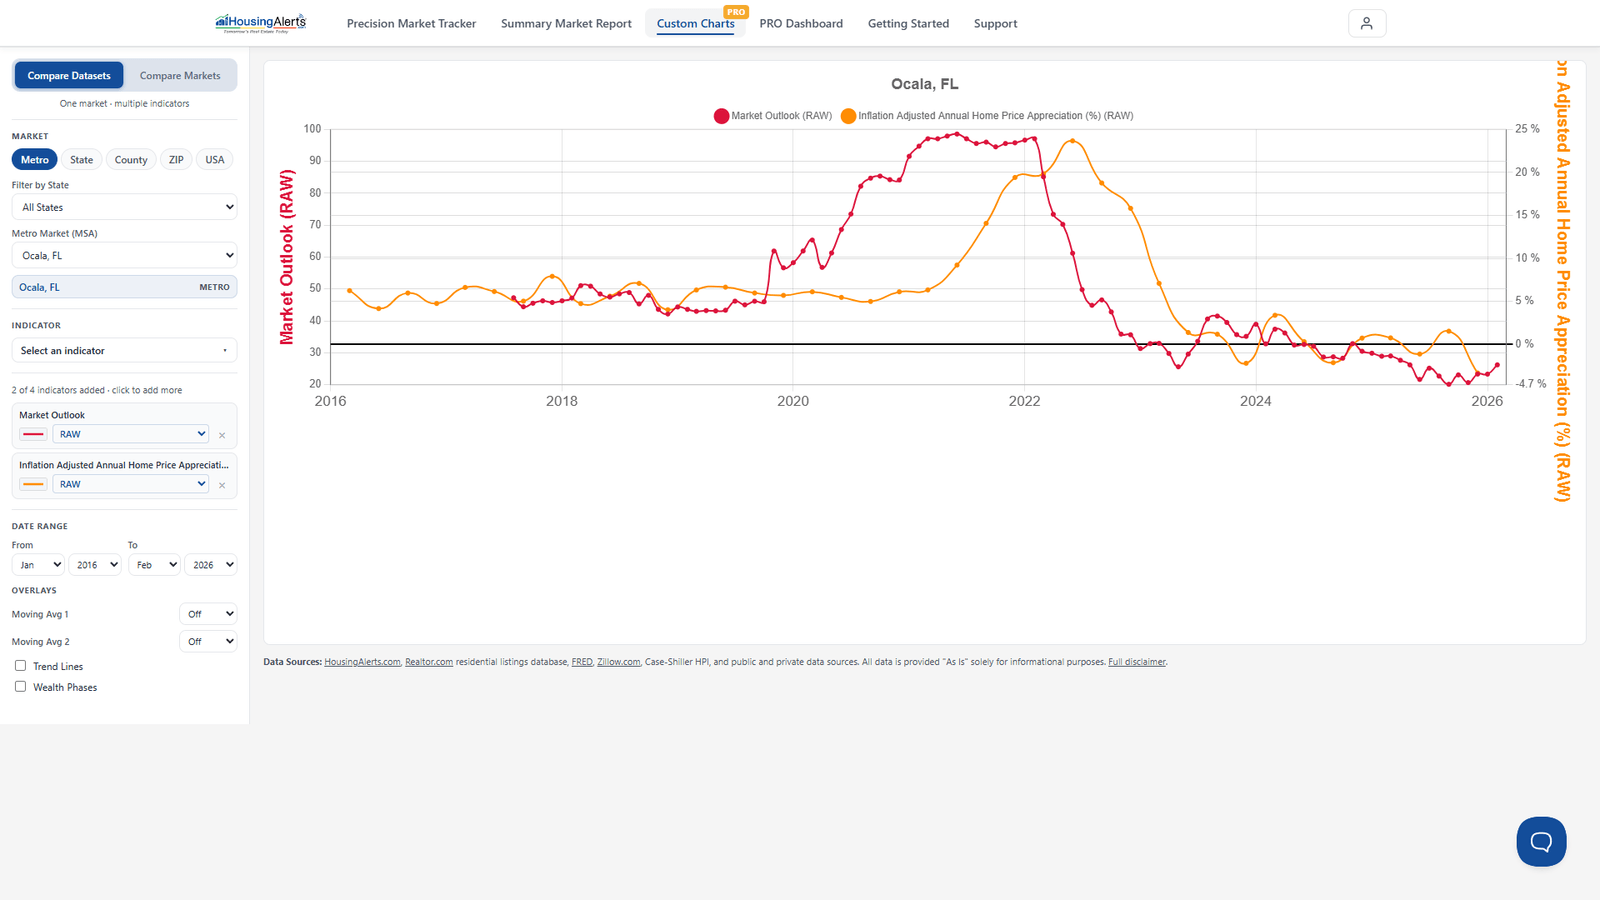
Like all quarterly measures it reacts faster than annual data (it only looks back three months), which helps you spot reversals sooner — at the cost of more short-term noise. Choose it from the dataset picker (under Appreciation Rates) to shade the Map or rank The Table.