
Question:
After watching your Special Report video presentation, I was wondering how your analysis is coming to those dollar amounts of potential gains and losses of maintaining or selling a property in a specific area…..the reported amount differences seem quite high.
Answer:
Yes — the difference is surprising once you stop giving your profits back in the down cycles.
To keep it simple, we assume all cash flow from rentals equals your expenses. (That's close to reality for most markets — roughly break-even once you factor in ALL expenses, reserves, and mortgage servicing.) It doesn't really change the comparison, because it's the same assumption for both scenarios.
So all we're really looking at is "REAL" (inflation-adjusted) APPRECIATION — which is where real estate wealth comes from.
When you buy & hold, you get the benefit of leveraged appreciation on the way up — but you also give it back in the down cycles. Here's a hypothetical to make it concrete:
Setup: $20,000 down on a $100,000 property. Five years later it's worth $180,000 (80% total appreciation). If you sold, you'd have $100k cash, of which $80k is profit — a 400% ROI on your $20k.
Here's where the two paths separate:
Buy & Hold (through the down cycle) You don't sell. The market enters a down cycle and loses ~10%/yr for 5 years. That $180k property is now worth ~$90k — you have about $10k of equity left. You hold and ride the identical next up-and-down cycle. Same 80% appreciation takes it to ~$162k, then the same down cycle takes it back to ~$81k. Now you have about $1k of your original equity left. You've lost ~95% of your original $20k.
Wealth Phase (sell at the top, re-enter at the bottom) You sell at the end of the first up-cycle and bank the $100k. At the start of the next cycle you re-invest it — at the same leverage ratio, $100k down now controls $500k of real estate. Same 80% appreciation takes it to $900k. You sell before the next down cycle, pay off the $400k mortgage, and keep $500,000 — of which $480,000 is profit. That's a ~2,400% ROI on your original $20k.
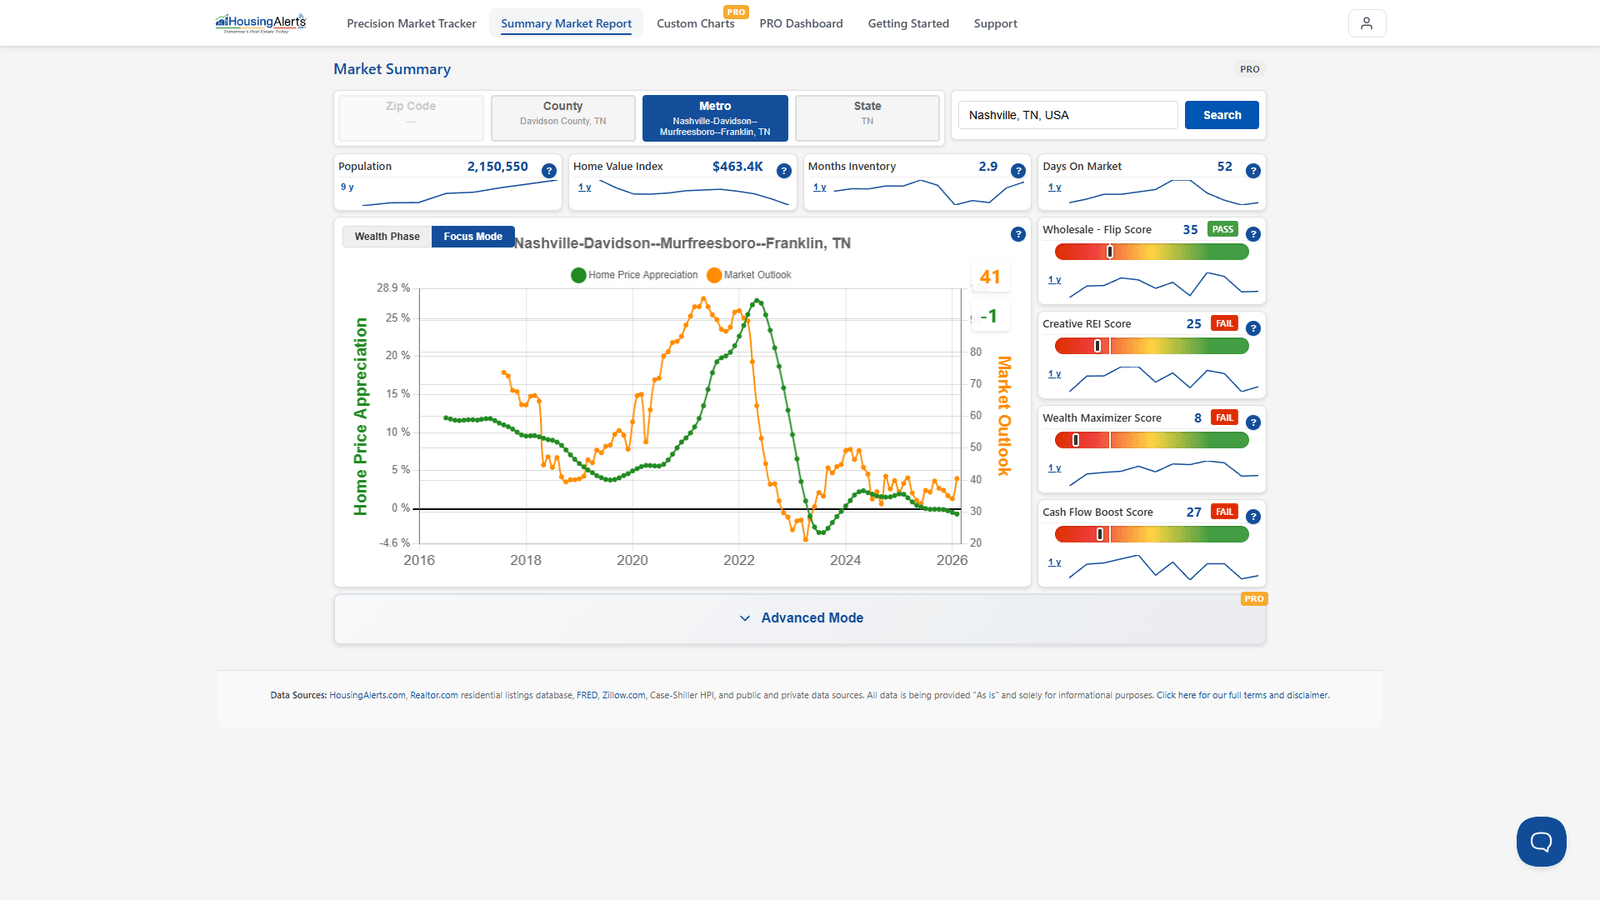
Same market, same cycles, same effort. The only difference is timing — being in during the Wealth Phase and out before the decline.
Where you see this today
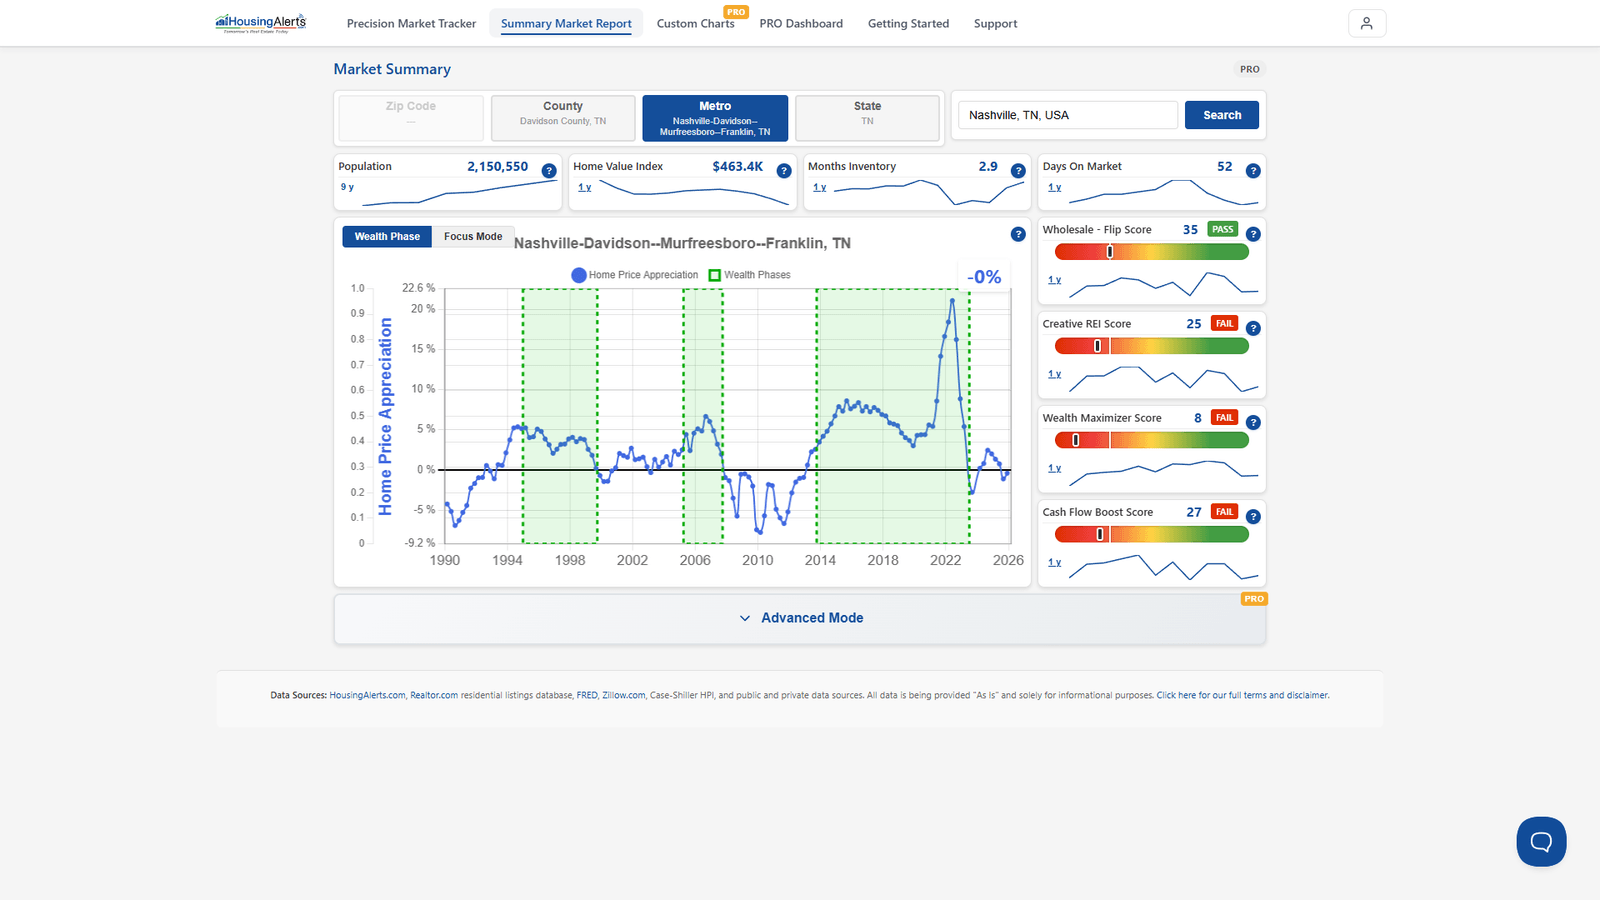
- The Wealth Phase Chart (Market Summary Report) shades exactly the windows you'd want to be in the market (green) and, by contrast, the periods you'd want to be out.
- The Market Outlook Score gives you a forward-looking read — roughly a year ahead — so you're not guessing when a cycle is rolling over.