
Annual Home Price Appreciation is [Inflation-Adjusted Annual Home Price Appreciation %] plus inflation. It's the appreciation figure normally quoted in the media.
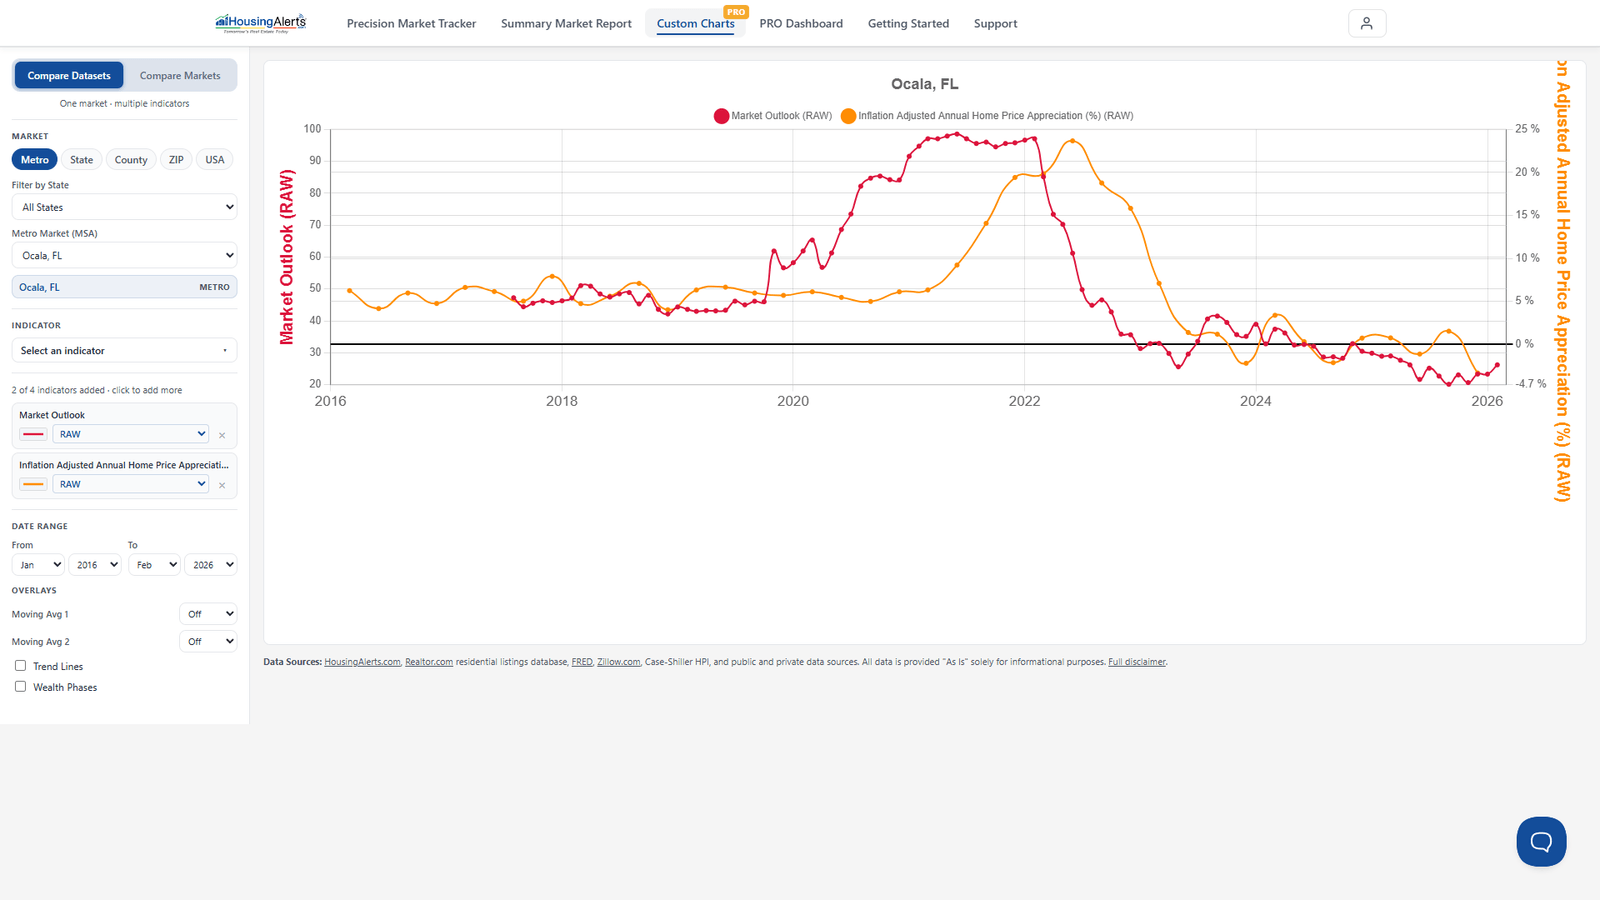
Appreciation is the increase in a home's value over time. A home's appreciation is calculated based on the fair-market value of comparable homes in the area.
On the new platform, choose this indicator from the dataset picker (under Appreciation Rates) to shade the Map by it or rank The Table by it, at any geography level from State down to ZIP.