
Inflation-Adjusted Annual Home Price Appreciation % is the key metric we use for most Technical Analysis, because it strips out inflation so we can measure the true Supply & Demand forces at work.
One way to think about it: if you were on a diet and weighed yourself every day — but sometimes in a full winter coat and boots, sometimes in your underwear, and other times in who-knows-what — the raw number would be misleading. Stripping out inflation is like weighing yourself the same way every time, so you can see the real change.
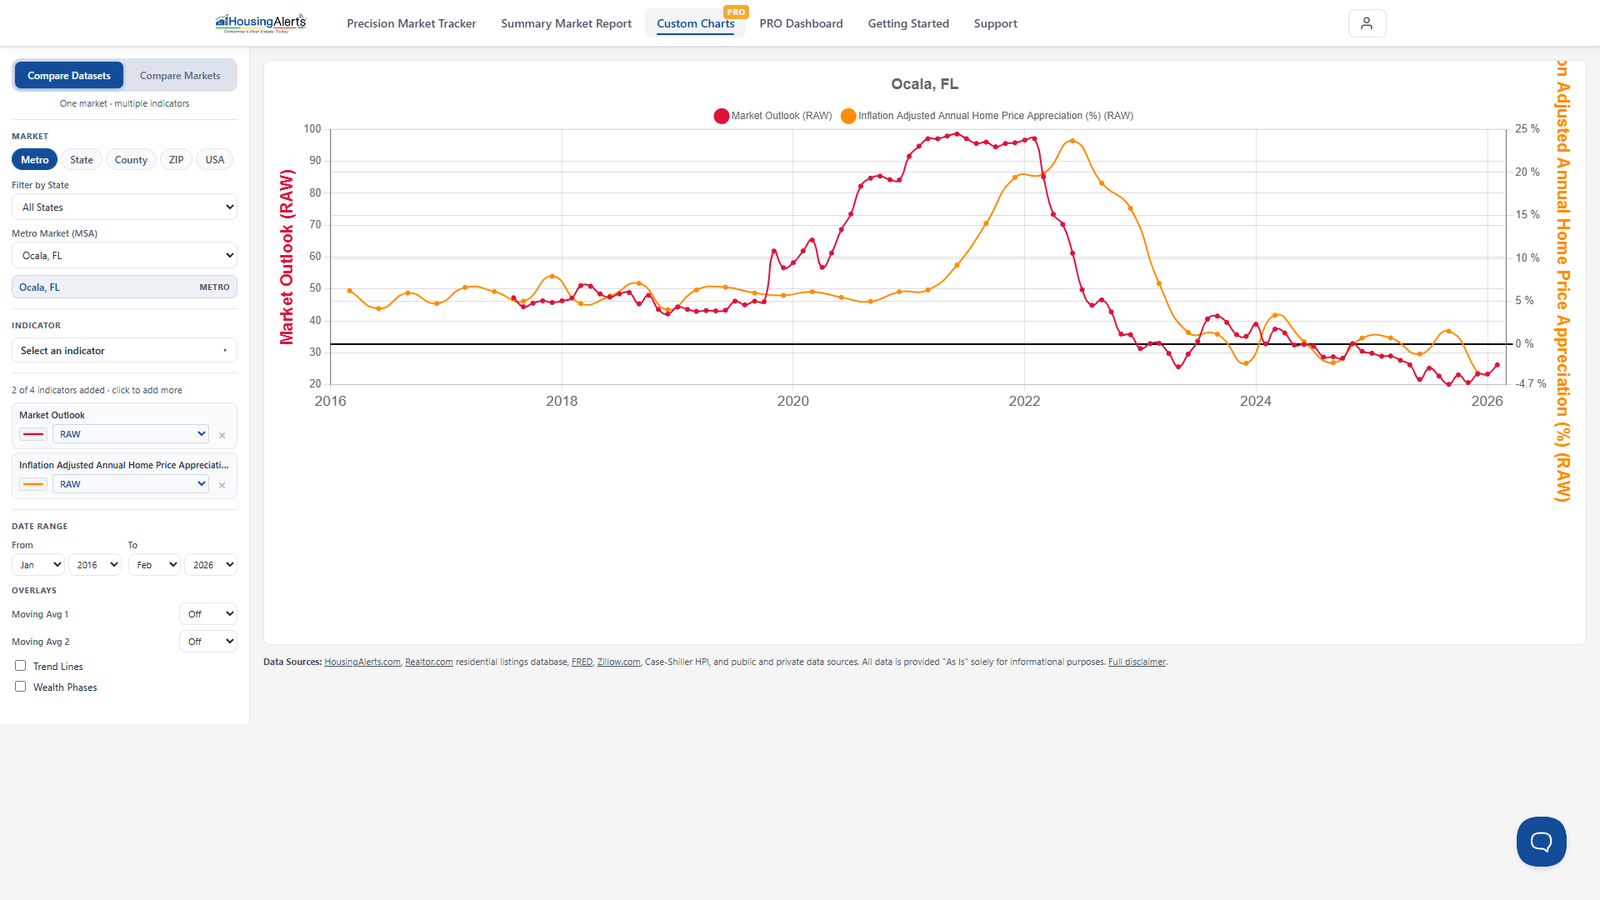
Choose this indicator from the dataset picker (under Appreciation Rates) to shade the Map by it or rank The Table by it. It's the same appreciation series as Annual Home Price Appreciation %, minus inflation.