
This is adapted from a note to a large real estate investor mastermind group about the wrong ways to predict real estate cycles.
The "Hot Markets" discussion comes up several times a year and often leads to confusing, conflicting content. Since 2006, HousingAlerts has been the most accurate local real estate market analysis system on the planet — we've nailed the precise start and end of every local momentum market in the USA for the last 40 years. Provable, back-testable results are all that matter; everything else is marketing spin.
Zillow, Trulia, and hundreds of others have tried and failed — and will always fail — as long as they use any of these four elements:
1) Fundamental Data. Cycles cannot be predicted from population growth, affordability index, in-migration, etc. Look at Texas: it ranked first or second in U.S. population growth from 1990–2005, yet had the second-lowest home appreciation rate in the country.
2) SHORT Time Frames (weekly/monthly). You hit a brick wall without statistically valid sample sizes — and it's simply the wrong time frame. Would you use a 5-minute stock chart to make long-term buy/sell decisions?
3) SMALL geographic areas (ZIP/county). A ZIP isn't a market — it's a tiny piece of one, with too few data points. Some ZIPs take a decade to yield usable information. Small-sample noise gets misread as signal — which is how you get "your ZIP is appreciating 79%/yr while the one next door is falling 110%/yr."
4) MLS data. The correlation is too weak to use even quarterly, even for entire metros. Plot NAR's quarterly median-price figures for a whole metro like Chicago and you get wild, unrealistic swings. Home prices don't jump 50–100% in a quarter and fall 40–60% the next.
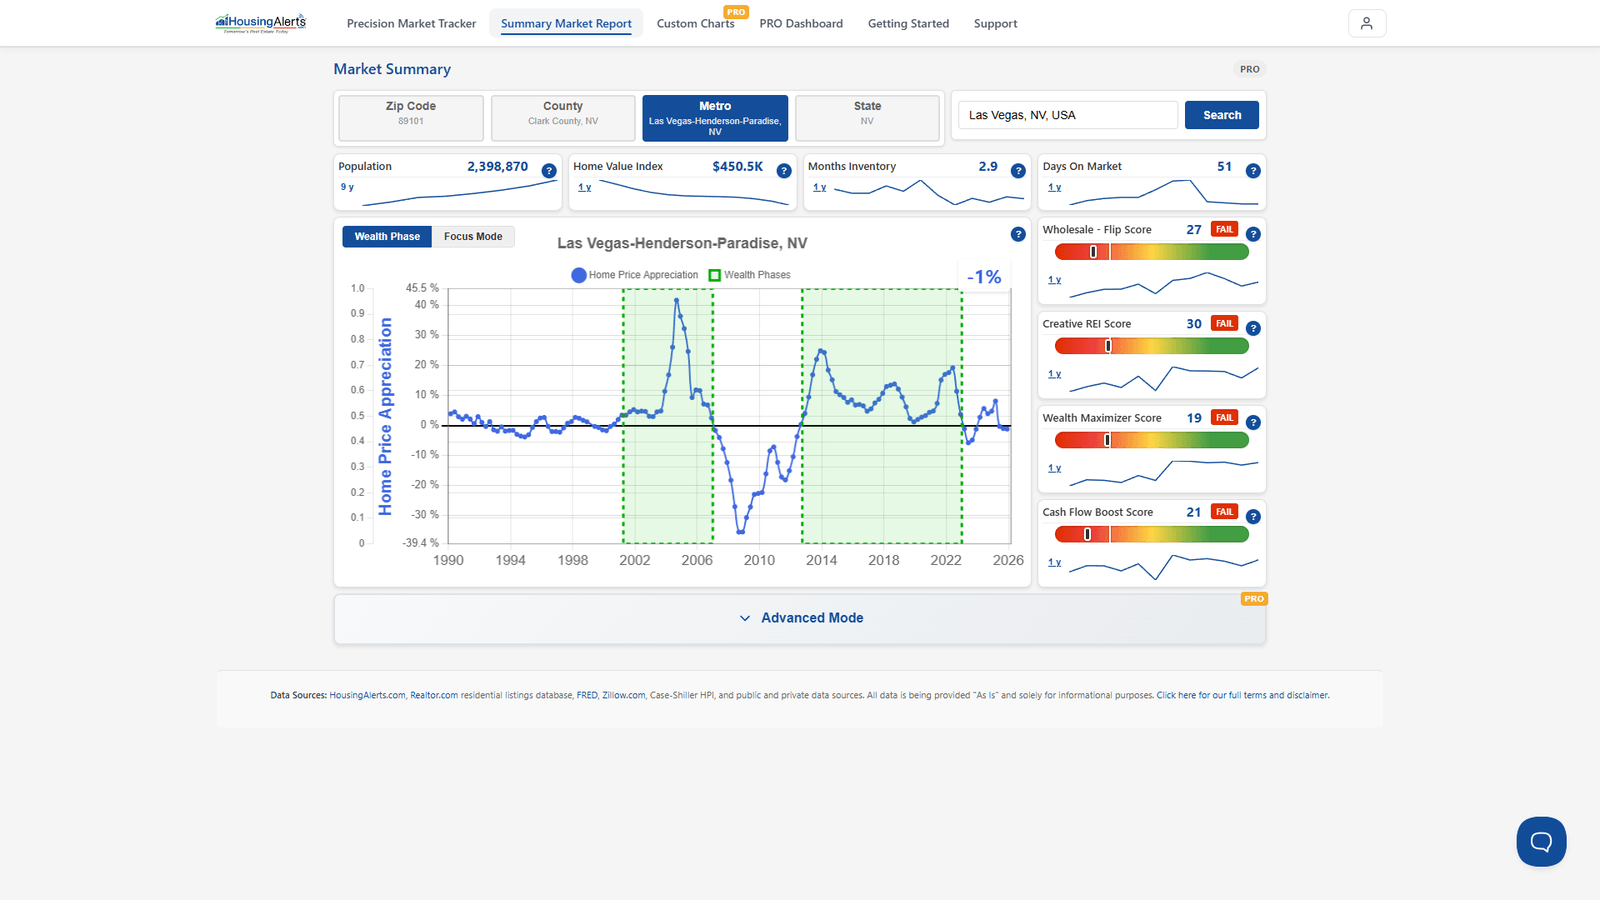
The fix is Technical Analysis on an accurate, repeat-sales database at the right geography and time frame — which is exactly what the new platform delivers as the Market Outlook Score and the Wealth Phase cycle chart. Whatever your strategy, you'll do better with accurate market intelligence — investing "blindfolded" is like driving at night without headlights.