
Question: What is the correct way to score and analyze zip code areas – should you look at CAGR, the color of the micro areas, or something else?
Answer: First and foremost: ZIP codes are exponentially harder to 'score' because they are NOT a market. They're small pockets with relatively few transactions, and that small sample size creates a lot of random noise with large swings from one period to the next.
You therefore cannot expect the same accuracy at the ZIP level that you get at the city/metro level. ZIP-level data will never replace the metro level for accuracy and reliability — think of ZIP data as the icing on the cake, not the cake.
With that in mind, analyze ZIP areas in this order:
- Start at the Metro level. If the overall metro market is red hot, its micro-markets will follow. A mediocre-looking ZIP in a hot metro will do far better than a "great-looking" ZIP in a mediocre metro. Only after you've identified a top-performing metro should you drop to the ZIP level.
- Then scan ZIPs on the Map (ZIP level). Don't get hung up on any particular color — you're only looking for ZIPs that performed relatively better than nearby ZIPs over the last 2–4 years.
- Use a 2-yr or 3-yr CAGR, not one-year data. Because ZIPs have so few transactions, one-year appreciation produces wild, often meaningless swings. A longer-term CAGR smooths the data by averaging over a longer period, revealing which ZIPs consistently looked relatively stronger than their neighbors. (It only takes seconds to check, so look at even longer CAGRs too.)
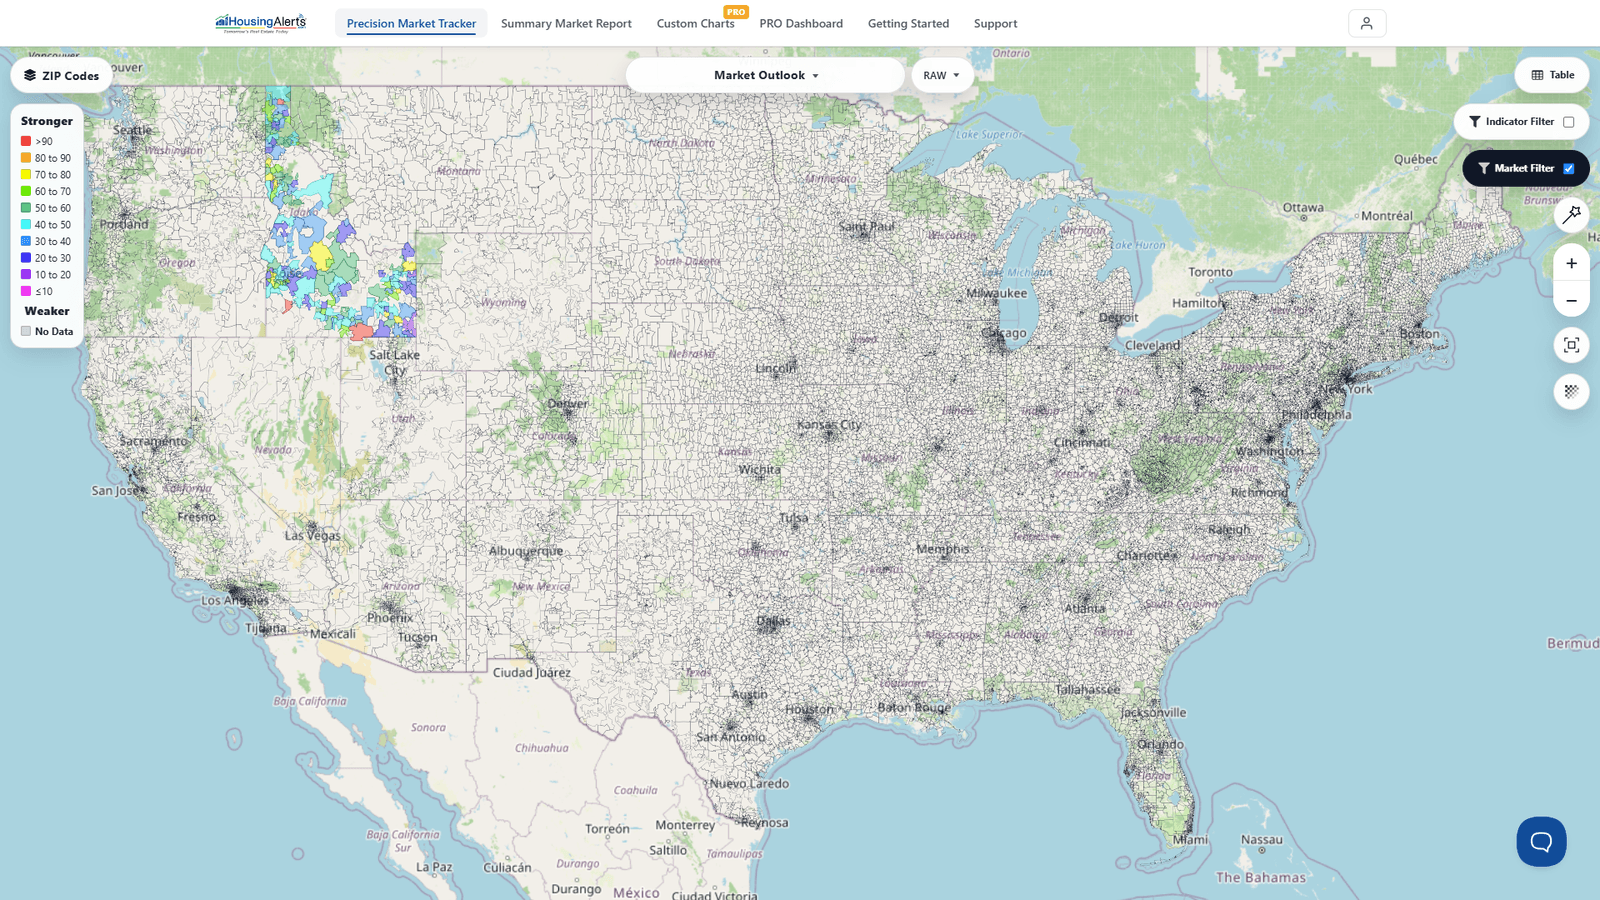
On the new platform you do all of this in the Precision Market Tracker: confirm the metro in its Market Summary Report, then switch the geography level to ZIP, shade the Map by a 2-yr or 3-yr appreciation CAGR, and scan for the consistently stronger pockets.