
Question:
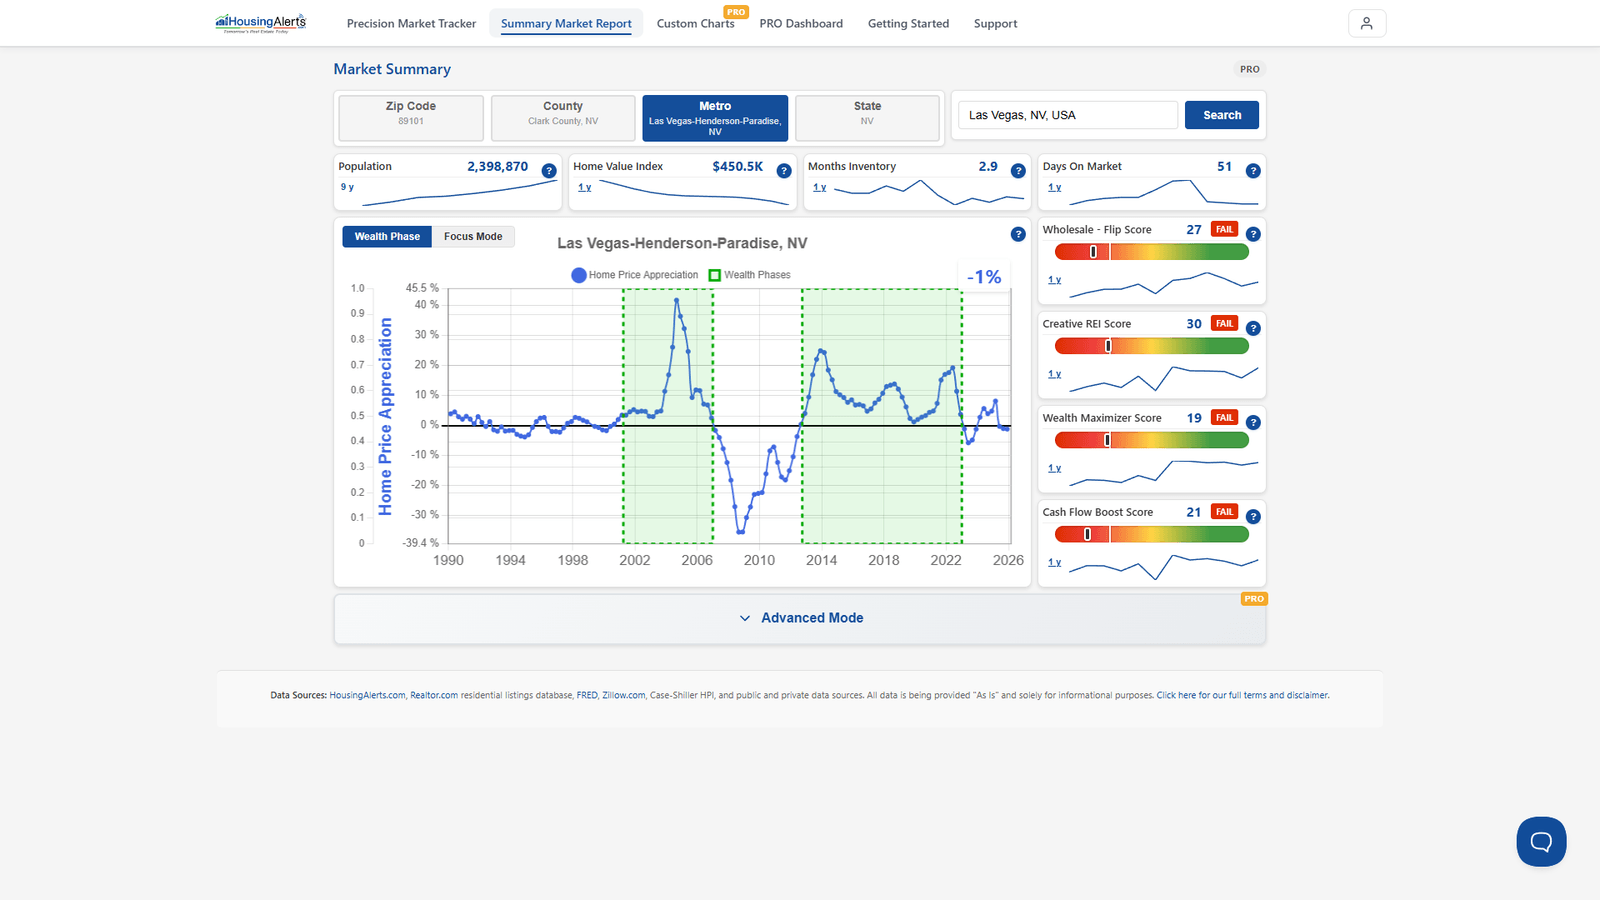
In the wealth phase chart, which line represents the slow moving average and the which represents the fast moving average? Does the fast moving average line signal about a year ahead?
Answer:
The moving-average (MA) lines individually don't have a fixed time period attached to them — but depending on how you use the green (fast) line, it can carry longer- or shorter-term implications.
For example, one way we use the green MA line is to help calculate a short-term S.T.A.R. momentum indicator: we look at whether the blue chart line is above or below the green (fast) MA line. That short-term indicator has a ballpark horizon of a few quarters at most. The MA itself doesn't translate into a time-period "prediction," and because the blue line bounces around, you shouldn't put much weight on the short-term S.T.A.R. indicators — except that any trend reversal has to begin with the short-term indicators. Treat a short-term color change as a wake-up call to pay closer attention; if it's more than random volatility, it'll work its way into the intermediate indicators.
- For intermediate horizons (about a year), what matters is the slope of the green (fast) MA line — is it pointing up or down?
- For long-term horizons (up to ~2 years), what matters is the green line relative to the slow (red) MA line — is it above or below it?
Of course, the S.T.A.R. indicators take much more into account than just the green MA line — but that's one way to think about time horizons via the fast MA.
On the new platform, you can view the Wealth Phase and add Moving Avg 1/2 overlays in Custom Charts PRO, and read the S.T.A.R. momentum interpretation of those lines in the Market Summary Report → Advanced Mode.