
We analyze a market on two important, independent variables (they don't always agree):
- a) Momentum — the red / yellow / green S.T.A.R. traffic-signal icons.
- b) Technical Score — the T.A.P.S. slider gauges.
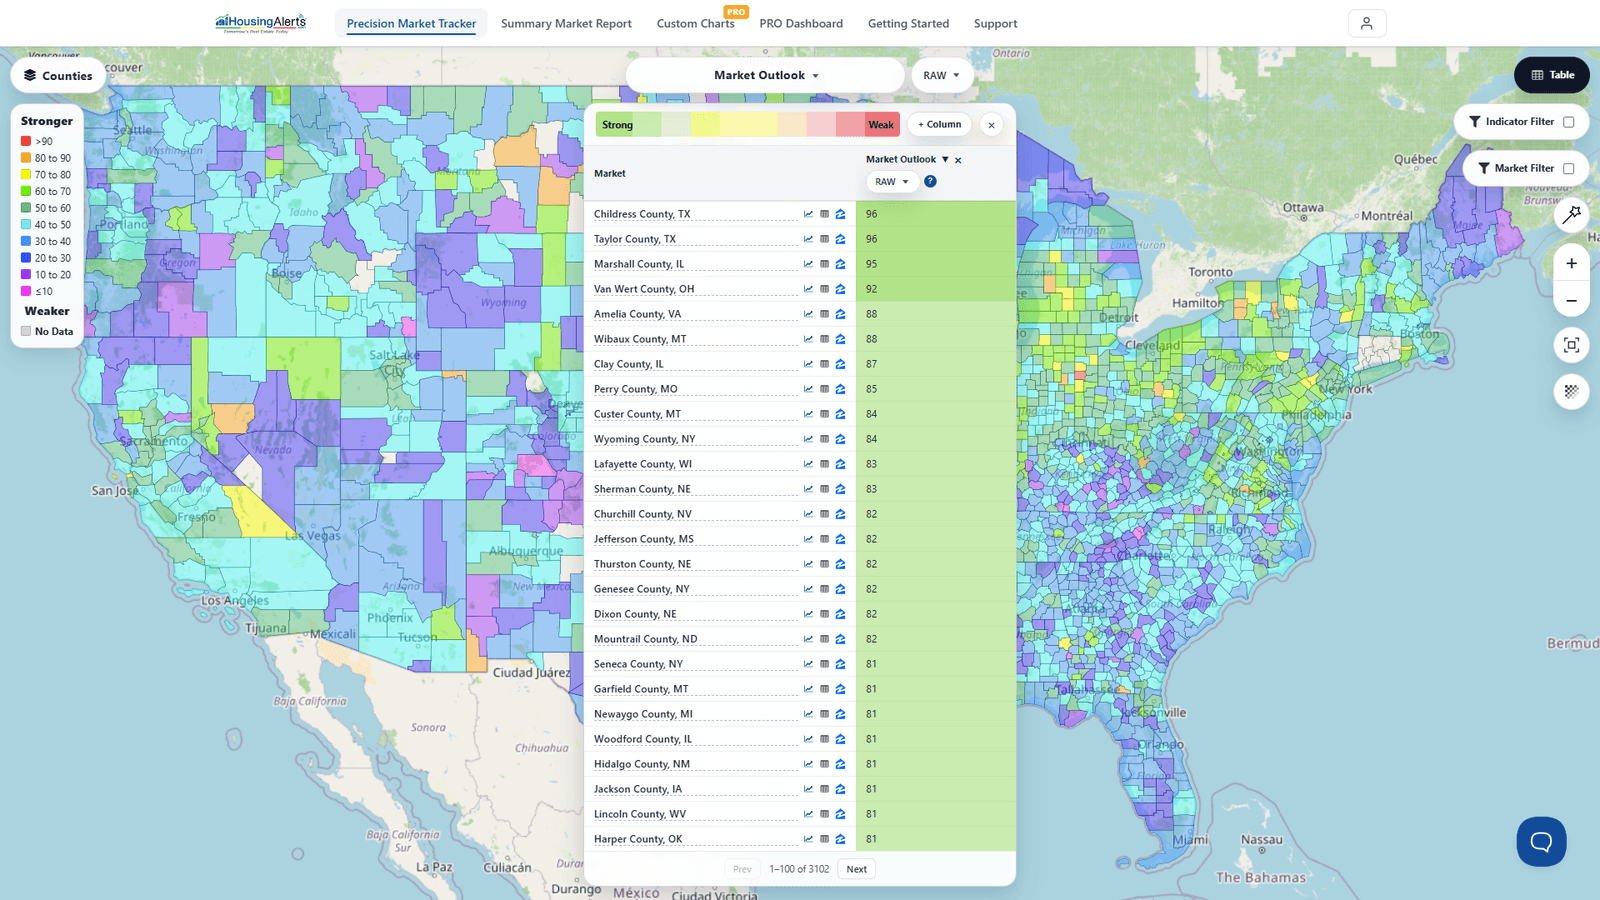
On the new platform, the easiest way to begin is The Table in the Precision Market Tracker: rank every market by the Market Outlook Score (which blends these signals) or add columns (+ Column) to compare S.T.A.R., T.A.P.S., THAR, and more side by side — the modern equivalent of the old Hot Market Finder's "Show Details."
Entering a new market: you want BOTH strong S.T.A.R. momentum (green, especially Intermediate/Long Term) and strong T.A.P.S. scores; first confirm the market is in a Wealth Phase. Rough importance: 1) Wealth Phase, 2) Market Outlook Score, 3) S.T.A.R. Momentum, 4) T.A.P.S. Combined, 5) T.A.P.S. Local, 6) 1-Yr THAR, 7) 4-Yr THAR.
Exiting a market: because of the cost/effort to exit, S.T.A.R. matters less except as an early-warning indicator — it can give a year or more of advance warning of a reversal. If the market is no longer in a green Wealth Phase, it's a question of "how bad is it?" Rough importance: 1) Wealth Phase, 2) T.A.P.S. Local, 3) 1-Yr THAR, 4) Market Outlook Score, 5) T.A.P.S. Combined, 6) S.T.A.R. Momentum, 7) 4-Yr THAR.
As a market accumulates more red S.T.A.R. icons AND weakening T.A.P.S. scores, the risk of decline rises and the odds of big appreciation fall. If you're not stuck in one market, when to leave is more about opportunity cost than milking the last bits of appreciation — a "Total Market Master" watches The Table to jump to new emerging markets at lower risk.