
In general, the multi-family market LAGS BEHIND the single-family residential (SFR) market. (Cases where multi-family rose before SFR in the most recent recovery appear to be an aberration.)
Technical Analysis (TA) can't be applied directly to multi-family or other CRE (Office, Retail, Industrial) in a specific city for a given quarter — there aren't enough sale transactions for a statistically valid sample. Even if there were, the data isn't directly comparable period-to-period because of the vast differences in the properties that happen to sell in any given window.
CRE transactional data can be purchased (very expensively) for a few of the largest cities. When we compared that CRE data (separately for Multi-Family, Office, Retail, and Industrial) to the housing market in those cities, in all comparisons the housing market's rise and decline PRECEDED similar CRE moves by a few months up to ~18 months. Multi-Family was the most closely correlated to housing; Industrial the least — but all showed significant correlation to the SFR market.
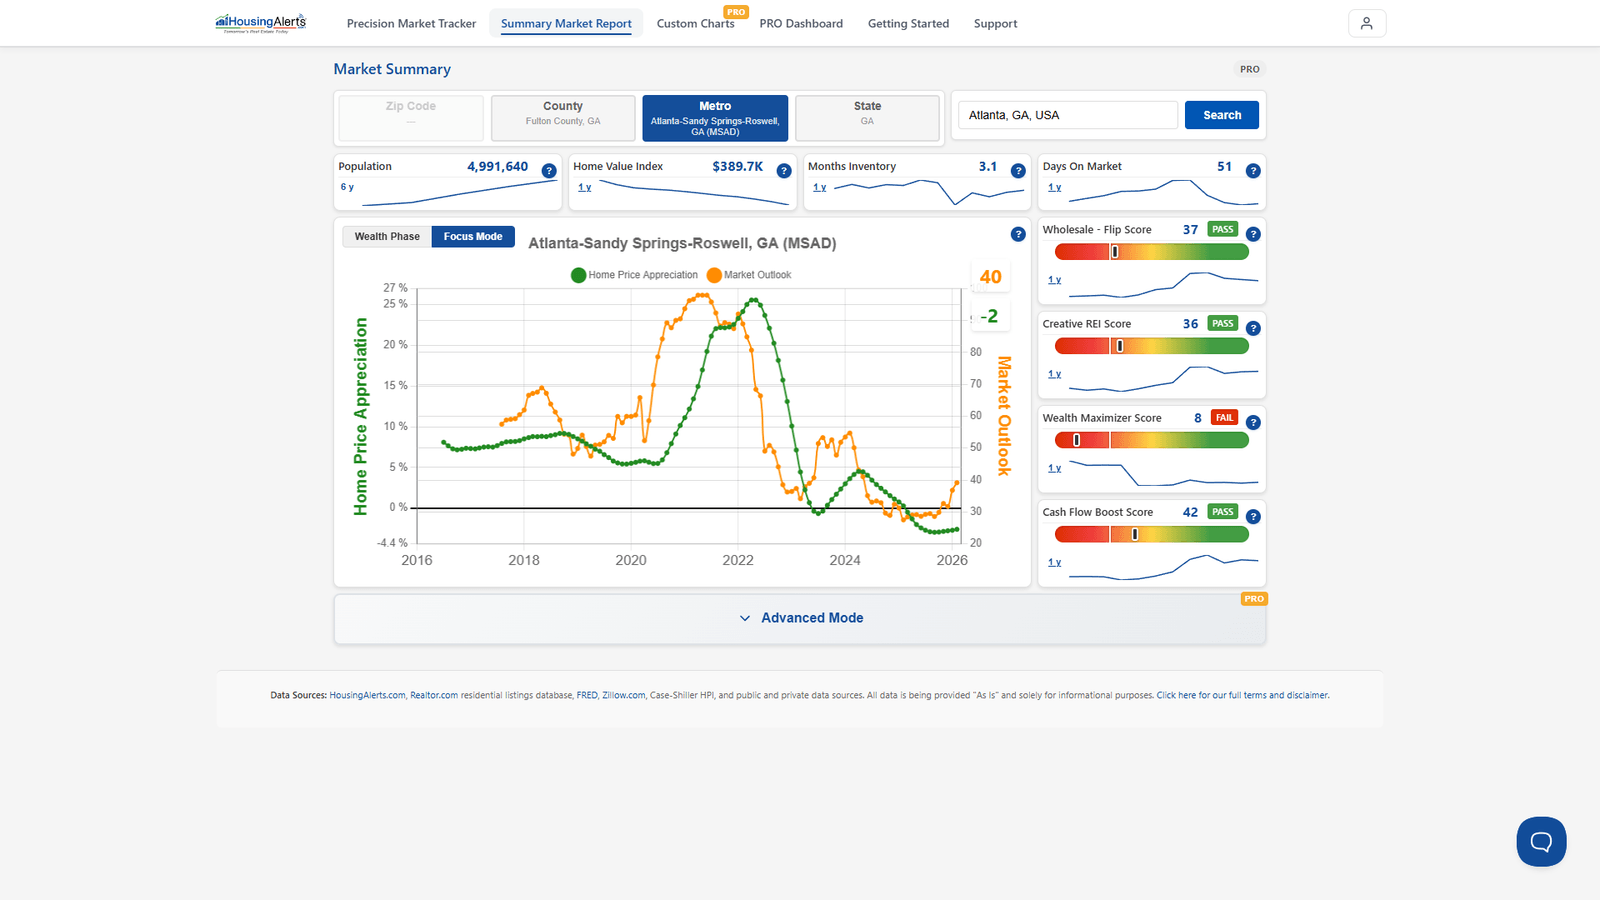
Intuitively this makes sense: retail "follows rooftops," a declining housing market bodes poorly for multi-family, and a hot housing market means a hot CRE market. So SFR data is the best predictor for what will likely happen in the same CRE market. Put another way: if I were considering CRE in a market with a poor HousingAlerts outlook, I'd need to buy at a higher cap rate to compensate for the added appreciation risk.
On the new platform, read the SFR Market Outlook and Wealth Phase for the market, and treat them as a leading indicator (with a lag of months to ~18 months) for its multi-family and commercial sectors.