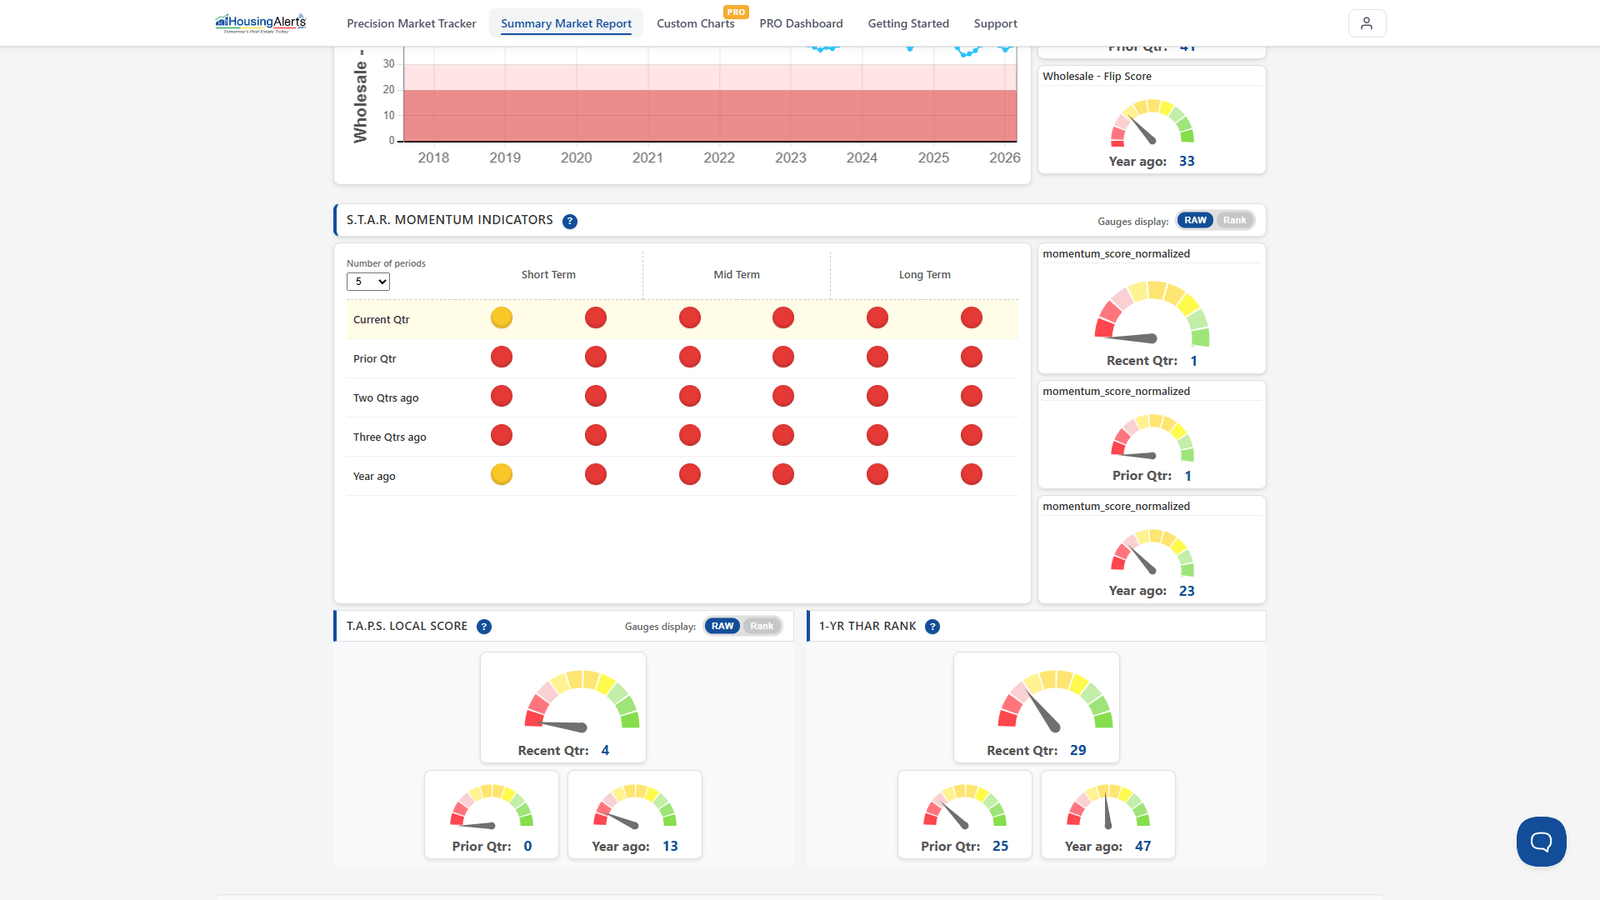
S.T.A.R. Momentum Indicators and T.A.P.S. Indicators
On the new platform, the S.T.A.R. and T.A.P.S. indicators live in the Market Summary Report → Advanced Mode (available at all geography levels). To learn to use them, watch the S.T.A.R. & T.A.P.S. tutorial in the free Video Training section.
S.T.A.R. — the basics. The Six Trigger Alert Report measures a market's momentum ('energy') using six triggers, split into Short / Intermediate / Long Term groups and shown as Green / Yellow / Red circles across the last five quarters:
- Green = positive, upward momentum.
- Red = negative/declining momentum.
- Yellow = the trigger changed direction this period.
Long-term greens carry the most weight; short-term flips are early-warning signals.
T.A.P.S. — the basics. The Technical Analysis Point Score measures a market's underlying strength, shown as a slider/gauge from Weak → Strong, aggregated and weighted from dozens of TA "Studies" and then ranked against all other markets.
Read them together — S.T.A.R. for direction/momentum, T.A.P.S. for strength — alongside the Wealth Phase and the Market Outlook Score. They're independent variables and don't always agree, which is exactly why using both gives a fuller picture than either alone.