Question:
When I put in the 50 states as a STAR search using today's date Aug 16, 2015 to find a desirable market, I see multiple states which are entirely green on their "circles chart to the right" which are ranked below other states which have some yellow in them. This seems to make no sense to me, if you are offering us a simplified system using the colors as meaningful. Where is the ranking information coming from that either places a state higher in the ordered ranking than a less green state, or that causes the slider bar to reflect a weaker position?
For example on the search: Texas is ranked fourth among the top 4 but it's circles are entirely all green. Massachusetts which is listed 2 below Texas has only a 60% strong slider bar as compared to the 99% slider bar representation by the top four, and yet is also has entirely all green circles. Why is there this disparity between the circles and the slider bar and priority rating?
Answer:
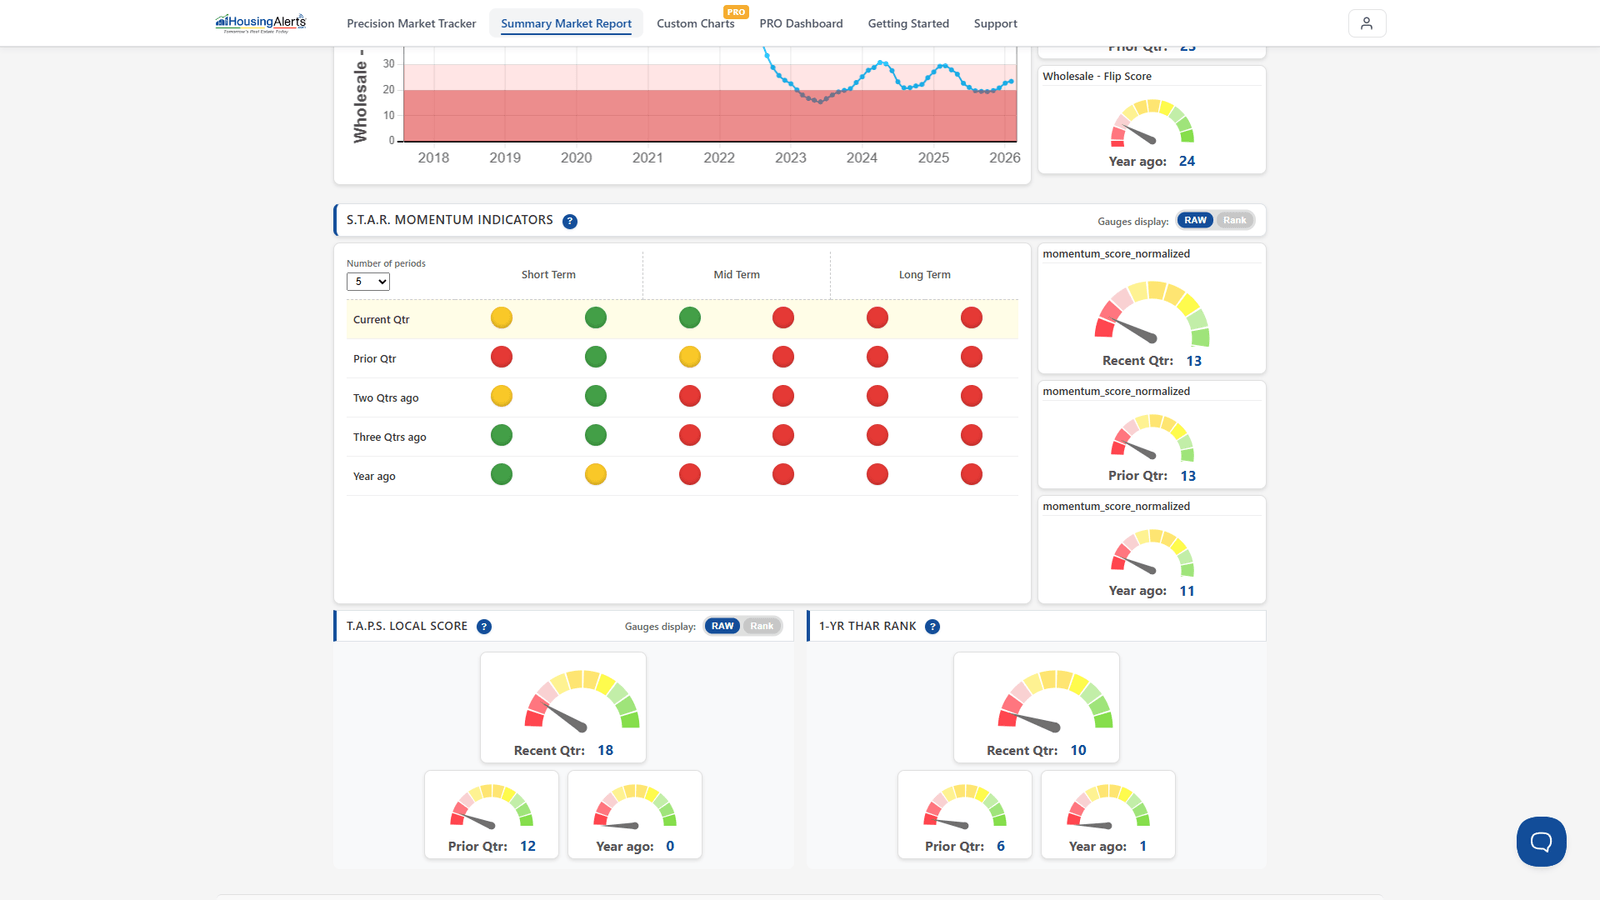
The apparent disparity is because the circles and the slider bar measure two different things — momentum vs. strength — and they don't always agree.
- The S.T.A.R. traffic-signal circles (Green / Yellow / Red) measure a market's momentum — its "energy" or direction over the short, mid, and long term.
- The T.A.P.S. slider ball measures the market's Technical Analysis strength — how attractive its underlying conditions are, ranked against all markets.
Two markets can both show all-green S.T.A.R. circles (both have momentum) while their T.A.P.S. sliders differ a lot (one is far stronger on the underlying conditions). That's not a contradiction — it's the two independent variables doing their jobs.
Ken's hierarchy of decision-making still applies, and on the new platform it maps cleanly onto The Table and the Market Summary Report:
a) Build a watch list of candidate markets by momentum first. If there's no strong momentum, it's not a good candidate today for leveraged appreciation. (On the new platform, rank The Table and read the S.T.A.R. Momentum in each market's report.)
b) Once you have a list of good-momentum markets, use the Market Summary Report to analyze them individually — the T.A.P.S. sliders, the S.T.A.R. circles, and the sample Wealth Phase indicators, all in Advanced Mode.
c) Remember, S.T.A.R. does NOT indicate an appreciating market — it ONLY measures momentum ('energy'), which is the first criterion in market selection, not the whole story.
d) You may want to look for new or emerging hot markets — not just those already in a solid multi-year uptrend. Many markets will be entering the first phase of their up-cycle over the coming months and years.