
An easy way to identify the hottest markets is to look for those scoring in the highest percentiles compared to all other markets. A score of "90" means the market ranks higher than 90% of all markets for that particular criterion. On the new platform these gauges are in the Market Summary Report → Advanced Mode:
- Market Outlook Score (formerly Master Score) — the best single indicator if you only want to look at ONE. A proprietary algorithm that integrates all of the data into a single forward-looking score.
- T.A.P.S. Combined Score — the Technical Analysis Point Score ranking after combining the local (city-level) market with its State, Regional, and National T.A.P.S. scores.
- T.A.P.S. Local Score — the T.A.P.S. ranking for that particular city ONLY, ignoring any State/Regional/National influence.
- Momentum Score (S.T.A.R.) — uses the S.T.A.R. indicator to measure and rank each market by its momentum.
- 1-Yr THAR — ranks markets by their raw Total Home Appreciation Rate over the previous year.
- 4-Yr THAR — ranks markets by their raw Total Home Appreciation Rate over the previous four years.
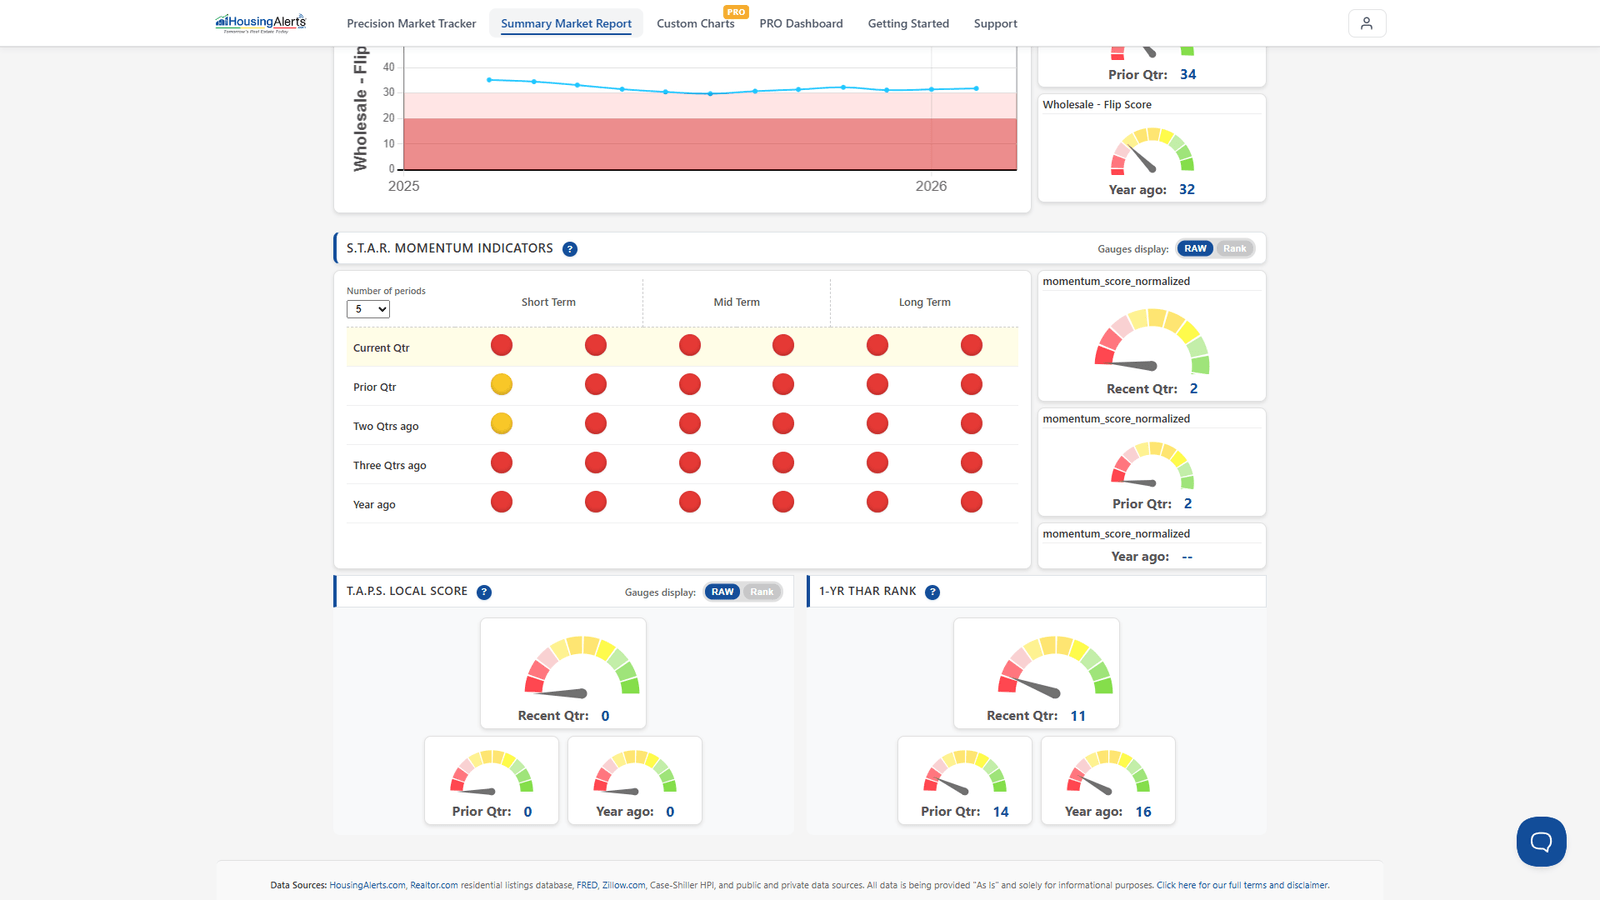
Read them together: the Market Outlook for the forward-looking call, T.A.P.S. for underlying strength, S.T.A.R./Momentum for direction, and the THAR gauges for recent raw appreciation.