
These live-listing indicators come from MLS data and are found under the MLS Indicators category in the Precision Market Tracker's dataset picker. Shade the Map by any of them, or rank The Table by them.
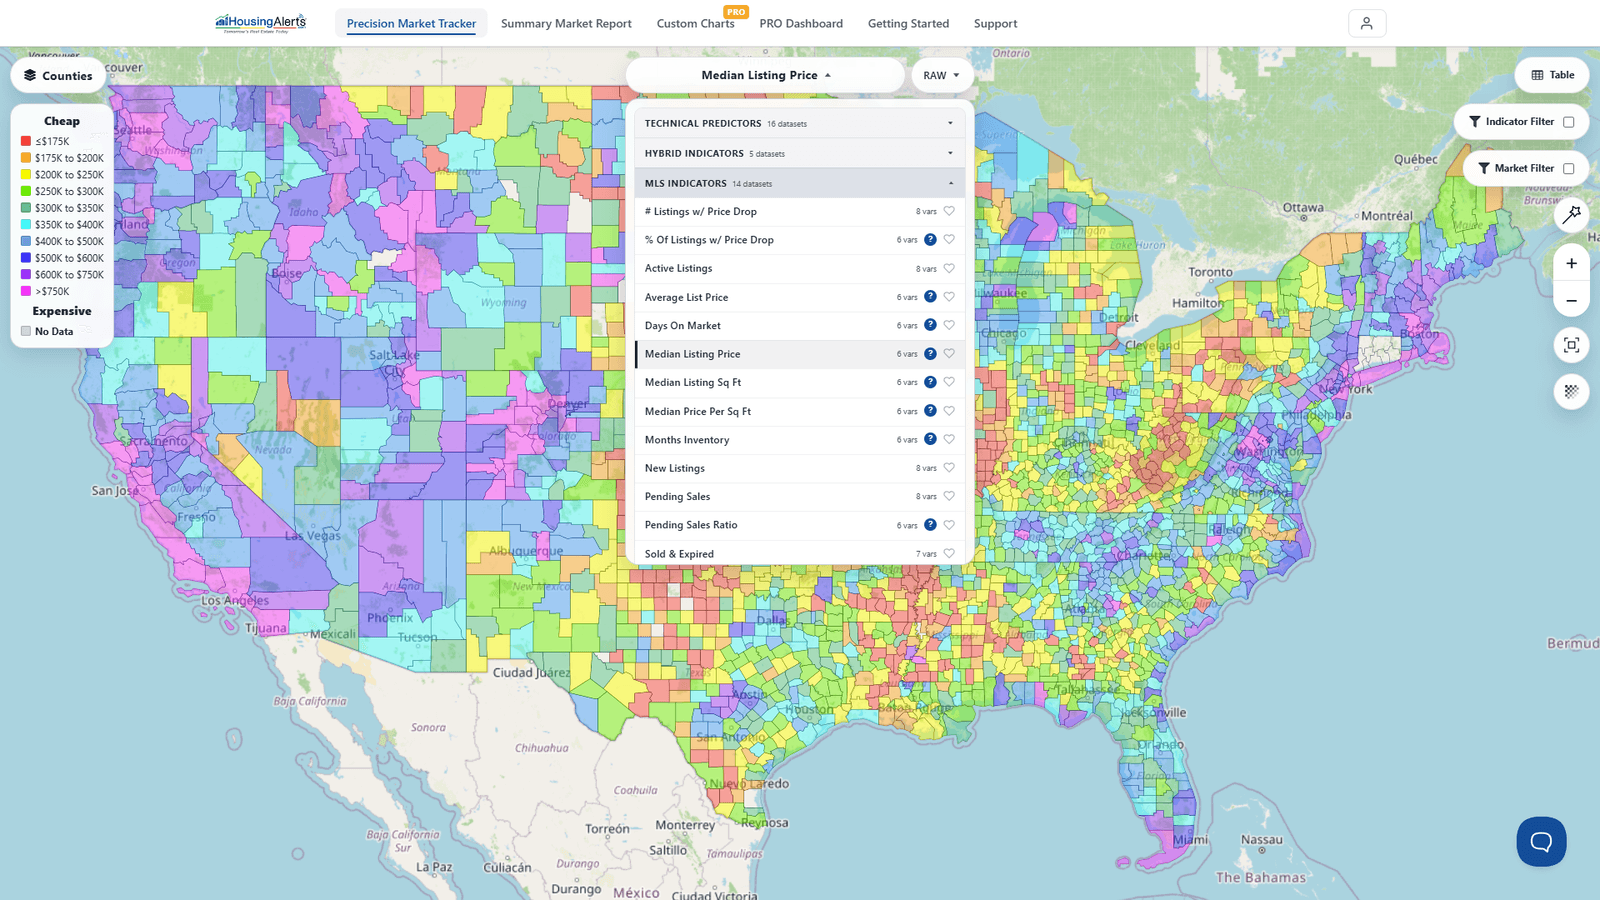
- % of Listings w/ Price Drop — the percentage of all listings that have had a price decline.
- Active Listings per 10K Pop. — properties for sale per 10,000 population in that market.
- Actual — spot data for a specific time period and market.
- Average List Price — the average price of all properties listed during the month.
- Days On Market — the median number of days between a property's listing and when it's marked 'sold' or 'off market'.
- Median Listing Price — the median price of all properties listed during the month.
- Median Listing Sq Ft — the median size of all properties listed during the month.
- Median Price per Sq Ft — the median price per square foot of all properties listed during the month.
- Month-over-Month — the current month's % change in the data vs. the prior month.
- Months Inventory — active listings for the current month ÷ (sold + expired listings from the prior month).
- New Listings per 10K Pop. — properties newly listed for sale per 10,000 population.
- Pending Sales per 10K Pop. — properties marked 'sale pending' per 10,000 population.
- Pending Sales Ratio — pending sales as a % of all active listings.
- Price Drops per 10K Pop. — properties with a lowered list price per 10,000 population.
- Price Increases per 10K Pop. — properties with a raised list price per 10,000 population.
- Sold & Expired per 10K Pop. — monthly sold + expired listings per 10,000 population.
- Total Listings per 10K Pop. — all active + pending listings per 10,000 population.
- Year-over-Year — the current month's % change vs. the same month a year earlier.
Version notes
- RANK / PCT — percentile rankings, 0 (weakest) – 99 (strongest), for that specific indicator. A '93' means the market scored higher than 93% of similar U.S. markets. Good for relative comparison between markets, not absolute performance.
- RAW — the actual numerical value; it doesn't rank against other markets, and multiple markets can share the same raw value. When an indicator combines others, the raw value is normalized to a 0–99 scale (99 = strongest).
- Some indicators (e.g. appreciation rates) are only available as RAW; others (e.g. hot-market scores) only as percentile RANK. Micro-markets (counties, ZIPs) often lack enough data for a statistically valid raw score, so the parent market's raw score is used.