
Here are plain-English definitions for the core terms and indicators used throughout HousingAlerts. In the new platform you'll find these indicators in the indicator picker at the top of the Map (and as columns in the Table), grouped into five categories: Technical Predictors, Hybrid Indicators, MLS Indicators, Appreciation Rates, and Fundamental Indicators.
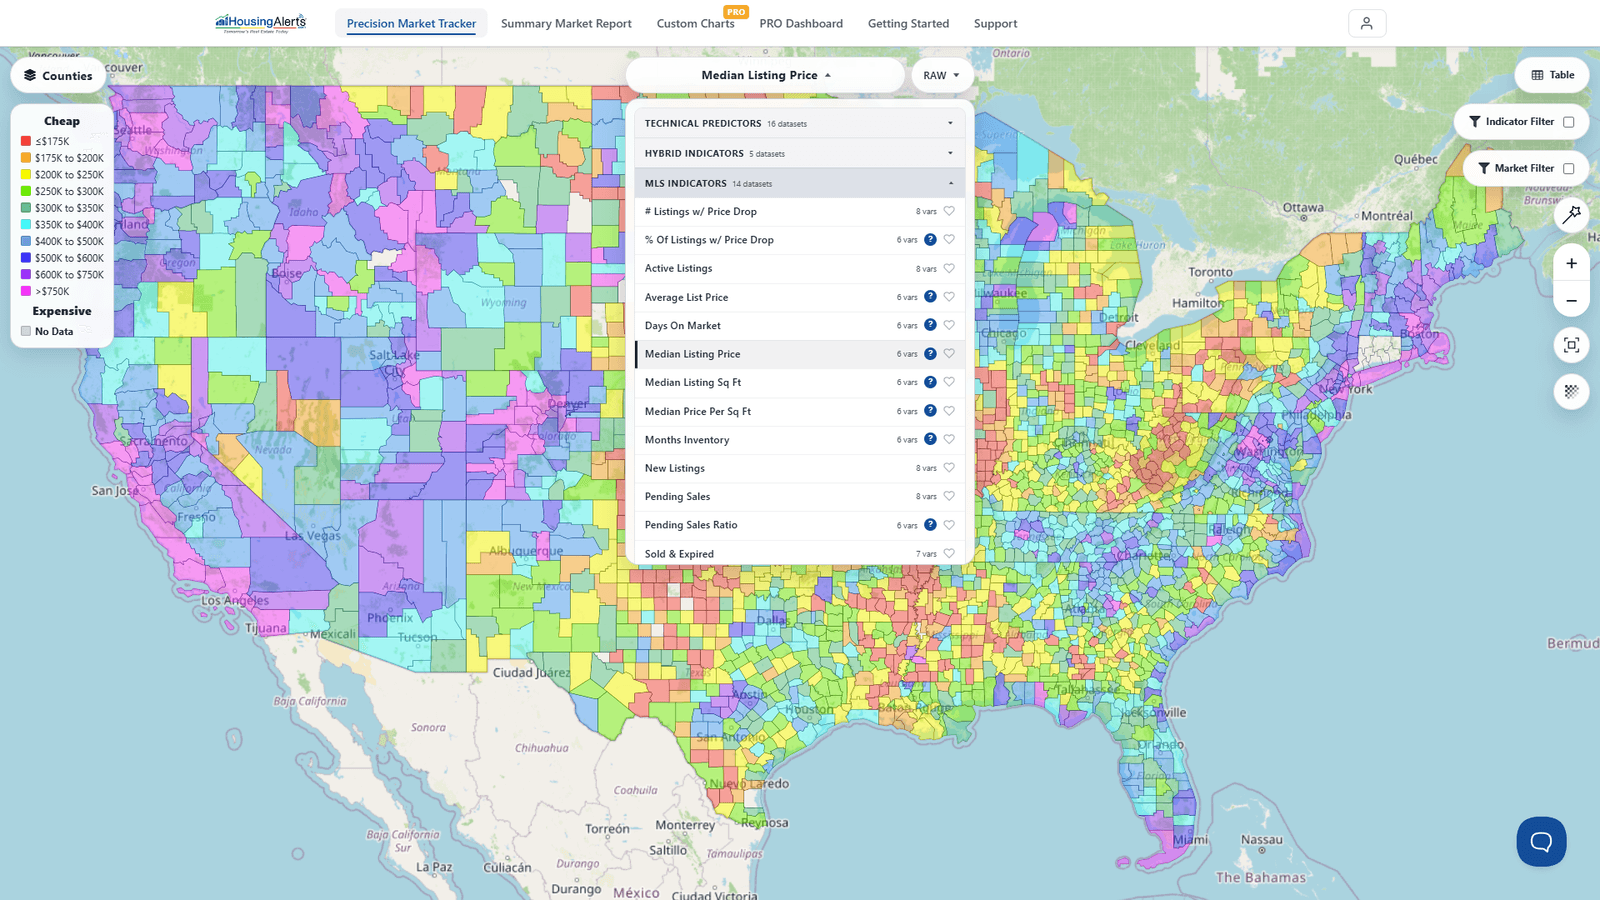
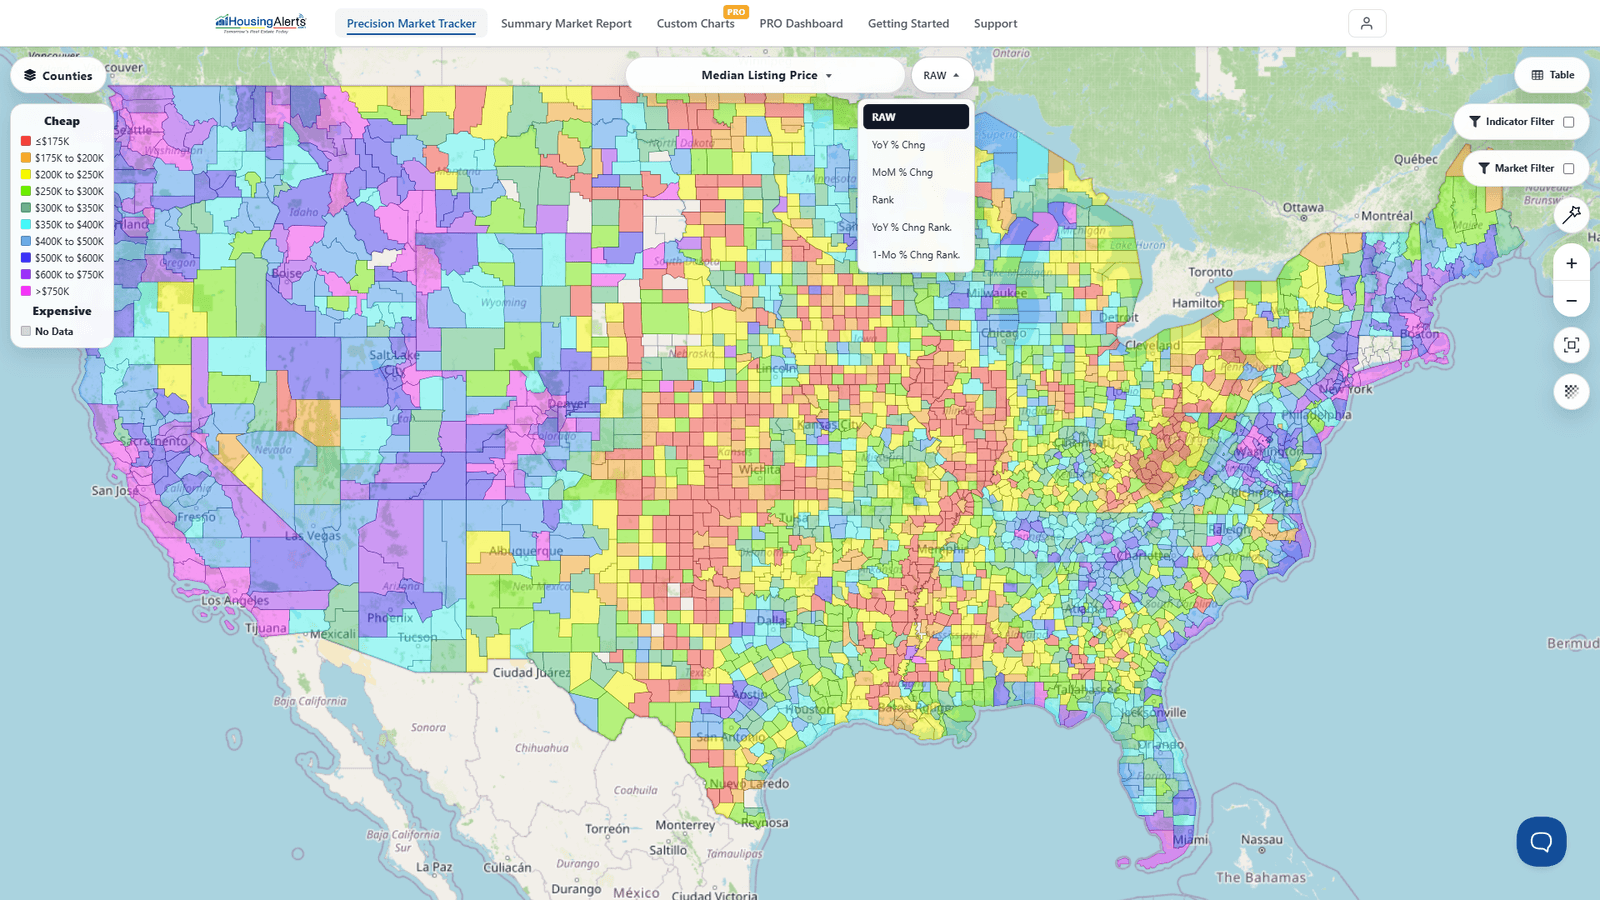
Most indicators are available in several data versions — RAW, YoY % Change, MoM % Change, and Rank — which you switch using the RAW button next to the indicator name. (RAW shows the actual value; YoY/MoM show the rate of change; Rank shows how the market compares to all others.)
Appreciation & price terms
Inflation-Adjusted Annual Home Price Appreciation % The key metric we use for most Technical Analysis, because it strips out inflation to measure the true Supply & Demand forces. Think of it like weighing yourself every day — but sometimes in a winter coat and boots, sometimes in your underwear. The clothing (inflation) masks what's really going on. This strips the clothing off.
Inflation Like all that clothing — it masks what's really happening with home values.
Annual Home Price Appreciation Inflation-Adjusted Annual Home Price Appreciation % plus inflation. This is what's normally quoted in the media.
Quarterly Home Price Appreciation (annualized %) The change in home prices from three months earlier, annualized (× 4) to get an annual-equivalent rate. Quarterly comparisons have more "noise" and bounce around more than annual ones — but because they only look back three months, they can spot reversals and turning points sooner.
Inflation-Adjusted Quarterly Home Price Appreciation (%) Same as Quarterly Home Price Appreciation (annualized %), but with the effects of general inflation removed.
Home Price Index (HPI) / Inflation-Adjusted Home Price Index An "index" is an easy way to compare different markets over time relative to each other. Pick any base year and set its home-price value to 100; every other year is then expressed relative to that base. This lets you compare very different markets (say, Detroit vs. San Francisco) on the same footing, and it captures the cumulative, compounding change in home values over many years. The Adjusted HPI removes inflation; the Raw HPI includes it (purchasing power).
CAGR (Compound Annual Growth Rate) A more accurate way to express an average annual change over a multi-year period. The 2- and 3-year CAGRs "smooth out" some of the wild swings in the data, giving a truer read on a market's relative performance.
Scoring & ranking terms
Market Outlook Score The flagship forward-looking predictor — the platform's best single read on where a local market is heading over roughly the next 12 months. Higher = stronger. (This is the modern evolution of what older training called the "Master Score.")
Wealth Phase The window in a market's cycle when conditions line up in your favor — steady appreciation, faster and stronger closings. The Wealth Phase Chart shades these windows green.
S.T.A.R. Momentum Direction-and-momentum indicators (Short / Mid / Long Term) shown as Green / Yellow / Red signals — whether a market is gaining or losing steam.
T.A.P.S. Local Score The Technical Analysis Point Score for that specific market only, ignoring any State, Regional, or National influence. It measures the strength of the local market.
Strategy Scores (Wholesale-Flip, Creative REI, Wealth Maximizer, Cash Flow Boost) Proprietary scores that re-rank every market for a specific investing strategy. A "PASS" means the market currently meets that strategy's conditions.
Note on colors: On the Map, indicators are shown as a color-coded heatmap on a best-to-worst spectrum (not simply red/green). Red/Green is used in the Table (strong-to-weak) and for the buy/sell signal concept (green = go, red = stop).