
Question:
Is there anyway to get data when the places are not covered in your MSA/city drop downs?
Answer:
HousingAlerts is a top-level market analysis tool — it answers the most important question of "when & where" you should invest.
Once you know the state of the market and its cycle, only then can you decide:
- If you should even be in that market
- What particular investing tactics, strategies and methods you should use (i.e. — wholesaling vs. buy & hold, vs. lease option, etc.)
In order for Technical Analysis to work, we use dead-accurate data for an entire market, typically a large city or metro. Very small towns and individual addresses do not represent a "market" on their own, and they lack a large enough number of transactions to create a statistically valid sample size.
However, once the overall market cycle has been determined, we have proprietary county- and ZIP-code-level tools to help you drill down deeper.
Although there are "micro-markets" that may buck the trend to some degree, it is the exception, not the rule.
Where you see this today
On the new platform you're no longer limited to a single MSA/city drop-down. The Precision Market Tracker lets you switch the whole system between geography levels and search directly:
- Use the geography-level selector to move between State → Metro → County → ZIP, so if a small town isn't its own selectable market, you can analyze the county or ZIP code it sits inside. Coverage now spans 50+ states · 410 metros · 3,100+ counties · 27,000+ ZIP codes — 30,000+ total markets.
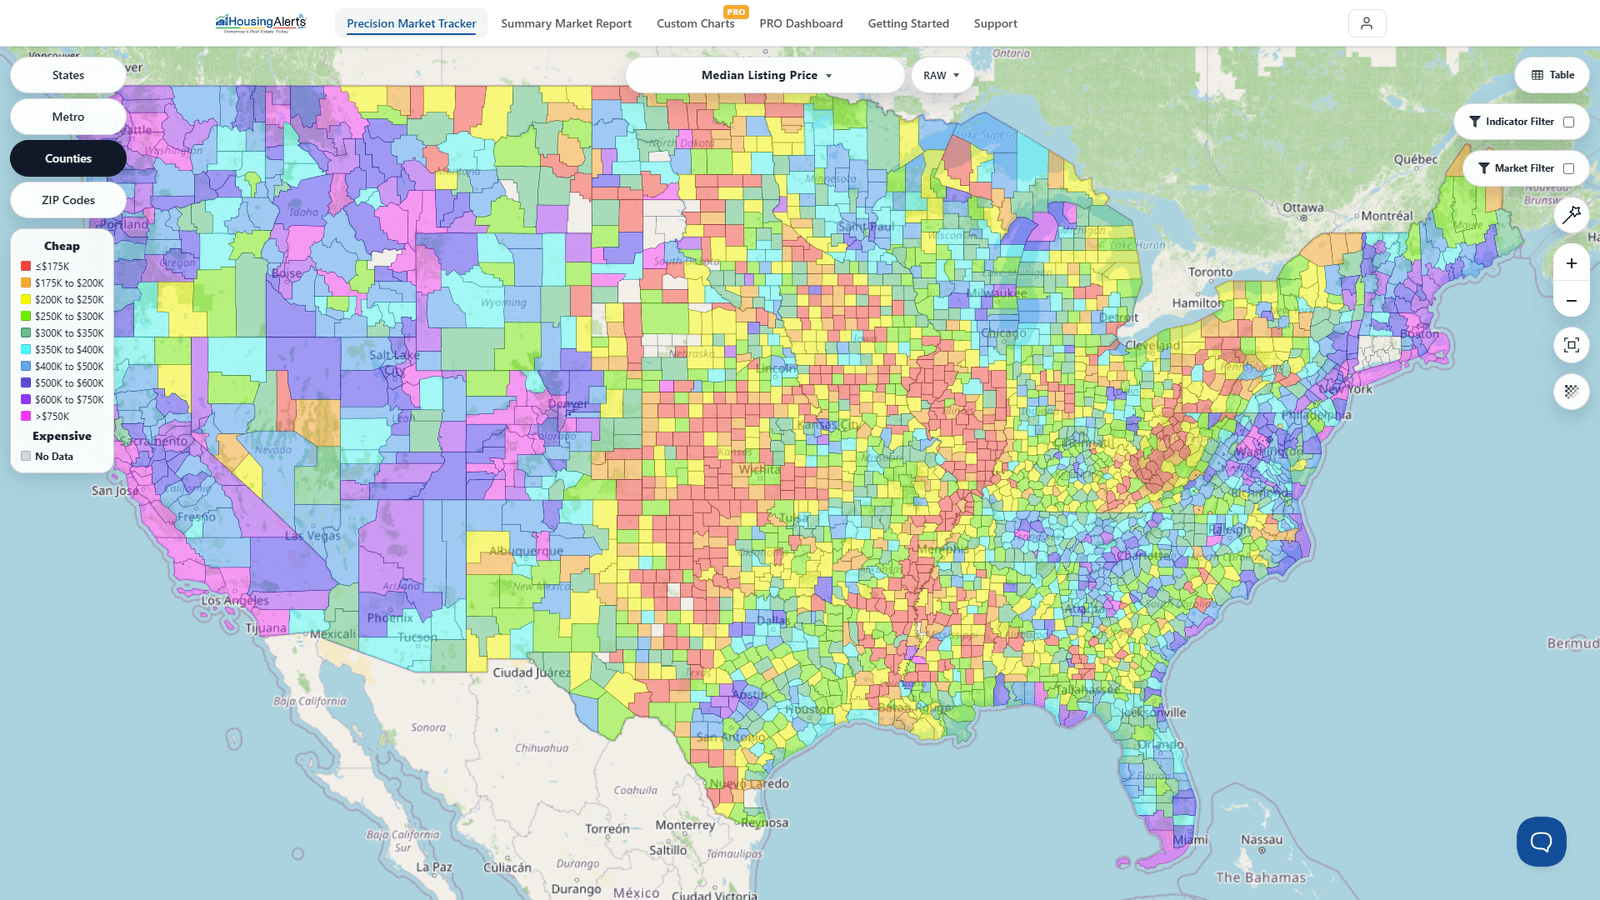
- After you've read the overall cycle at the metro or county level, drop to the ZIP-level Micro Markets view to drill down inside that market. The Map shades every ZIP best-to-worst on the indicator you choose, so you can spot the stronger and weaker pockets within a larger market.
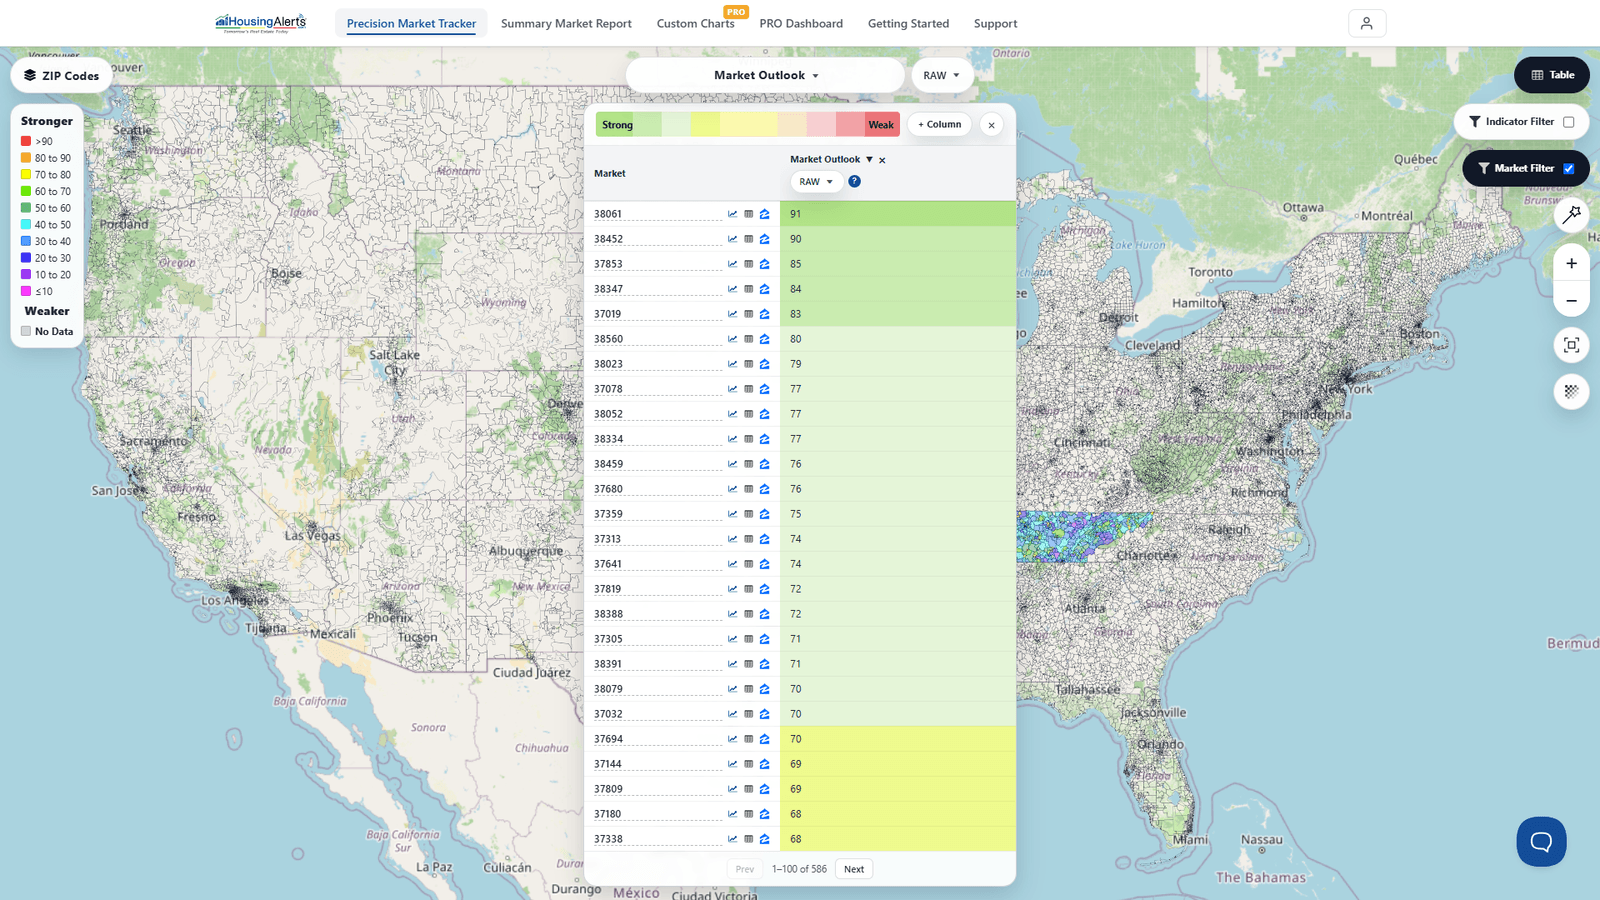
- You can also type any Metro, County, or ZIP straight into the search box on the Market Summary Report to pull that market's full scorecard.
If a specific place still isn't listed, it simply doesn't have enough transaction volume to be a statistically valid market on its own — analyze the county or metro that contains it instead. That larger market's cycle is what actually drives what happens on the ground in the smaller town.