Question:
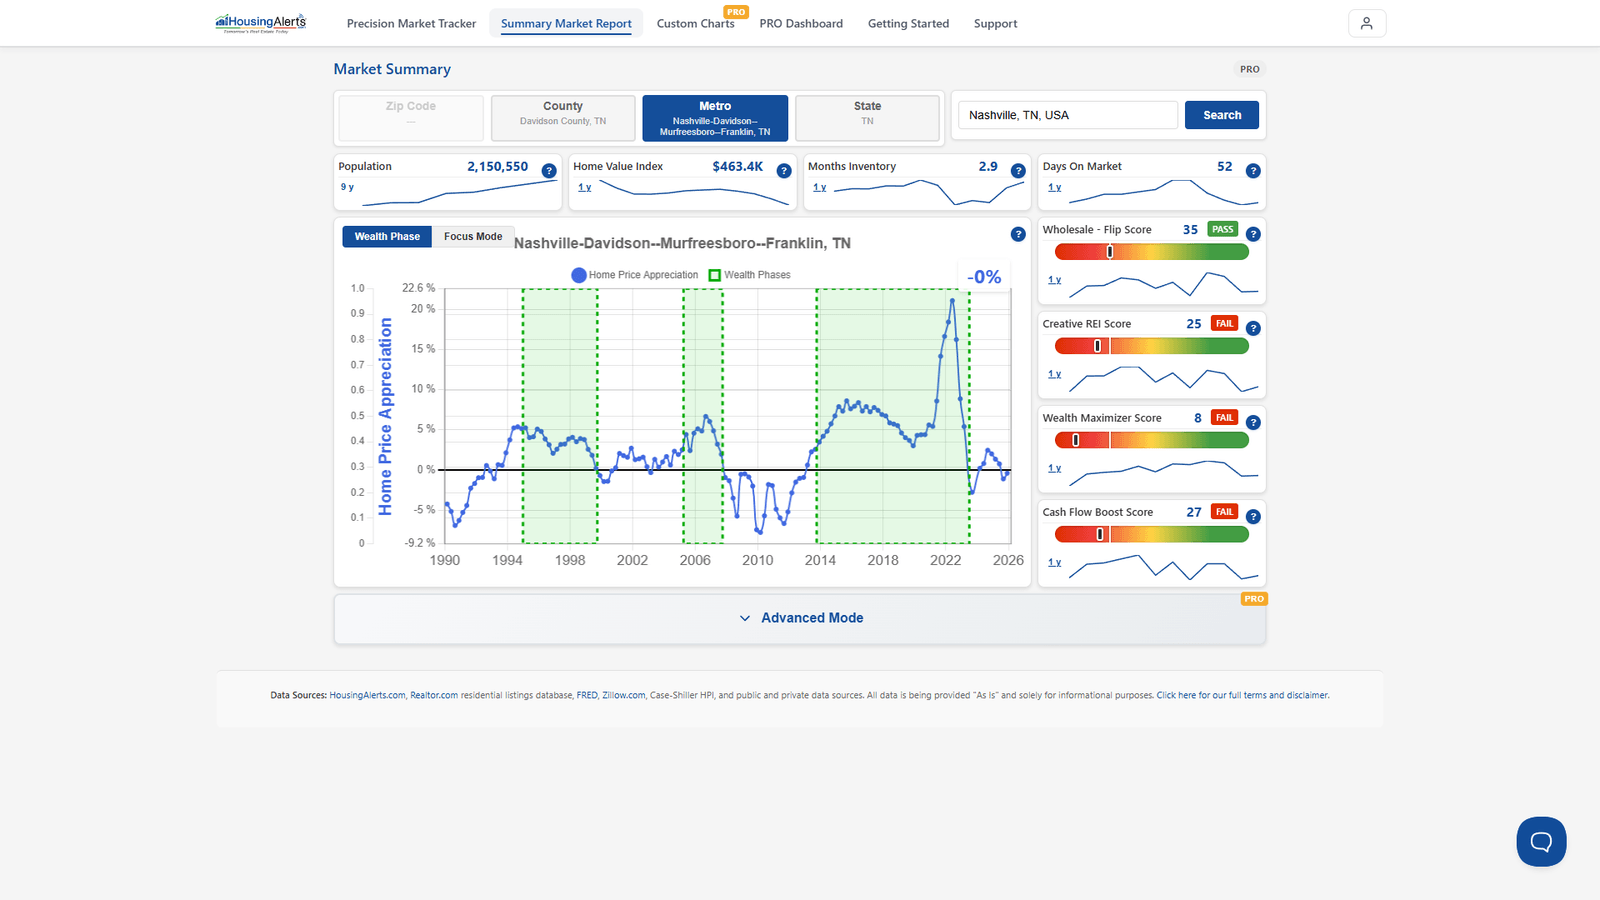
How do we interpret the different combination of movements of the three lines in the Wealth Phase charts?
Answer:
The moving-average lines are used primarily to determine a market's momentum. The S.T.A.R. indicator (the red/yellow/green traffic-light icons) was designed to interpret the chart and its moving-average lines for you, so you don't have to become a chart-reading expert — the S.T.A.R. icons and the MA lines are largely one and the same.
We analyze a market on two important, independent variables (they don't always agree):
- a) Momentum — the red / yellow / green S.T.A.R. traffic-signal icons.
- b) Technical Score — the T.A.P.S. slider gauges.
When ENTERING a new market, you want to see BOTH strong S.T.A.R. momentum (lots of green, especially Intermediate and Long Term) and strong T.A.P.S. scores — together they make it less likely the market rolls over soon.
Rough importance when ENTERING: 1) Wealth Phase, 2) Market Outlook Score, 3) S.T.A.R. Momentum, 4) T.A.P.S. Combined, 5) T.A.P.S. Local, 6) 1-Yr THAR, 7) 4-Yr THAR.
Once you're already invested, because of the cost/effort to exit, S.T.A.R. matters less except as an early-warning indicator.
Rough importance when EXITING: 1) Wealth Phase, 2) T.A.P.S. Local, 3) 1-Yr THAR, 4) Market Outlook Score, 5) T.A.P.S. Combined, 6) S.T.A.R. Momentum, 7) 4-Yr THAR.
On the new platform, the Wealth Phase and its moving-average overlays live in the Market Summary Report and in Custom Charts PRO (add Moving Avg 1/2 and the Wealth Phase overlay). The S.T.A.R./T.A.P.S. read is in the report's Advanced Mode.