
Question:
In the Training video "LOOK OVER MY SHOULDER" from 2nd qtr 2010, Ken Wade narrates doing a national search to see what the market is doing. Although he says that the markets will be ranked in priority from top to bottom, he disregards the states that are ranked highest in the STAR tool, and he disregards the TA slider results and proceeds down the list to CA which is 4th on the list. Even though his system is placing Alaska, Texas and Hawaii as a better choice for results using this system, he says that due to his inspection of what is showing with the Green, Yellow and Red circles, that CA is or has more momentum than the states listed above it in the Star Tool. Why is he doing that? And, if CA is the best area to focus on, why isn't it at the top of the list in the national search results?
Answer:
Because T.A.P.S. and S.T.A.R. measure two different things, and the ranking you see depends on which one you let drive the list.
- T.A.P.S. (Technical Analysis Point Score) measures the strength of a market — how attractive its underlying conditions are right now.
- S.T.A.R. (Six-Trigger Alert Report) Momentum measures direction and momentum — whether the market is gaining or losing steam over the short, mid, and long term. These are the Green / Yellow / Red signals.
In that old example, the search was set up so the momentum indicators were effectively ignored, so the states were ranked only on their T.A.P.S. scores. That run happened at the depths of the last crash — every state's T.A.P.S. score looked poor, and none had any real upward momentum. The point of the exercise was to spot the first signs of positive momentum, not to find an investment-grade market. So a slightly higher T.A.P.S. score on a market with no momentum was irrelevant. The one market showing early "green shoots" of momentum was the one worth pointing out — even though it wasn't at the top of a T.A.P.S.-only list.
The rule still holds today: if a market isn't showing upward momentum, the T.A.P.S. score alone doesn't mean much. Read them together — strength and momentum.
Where you see this today
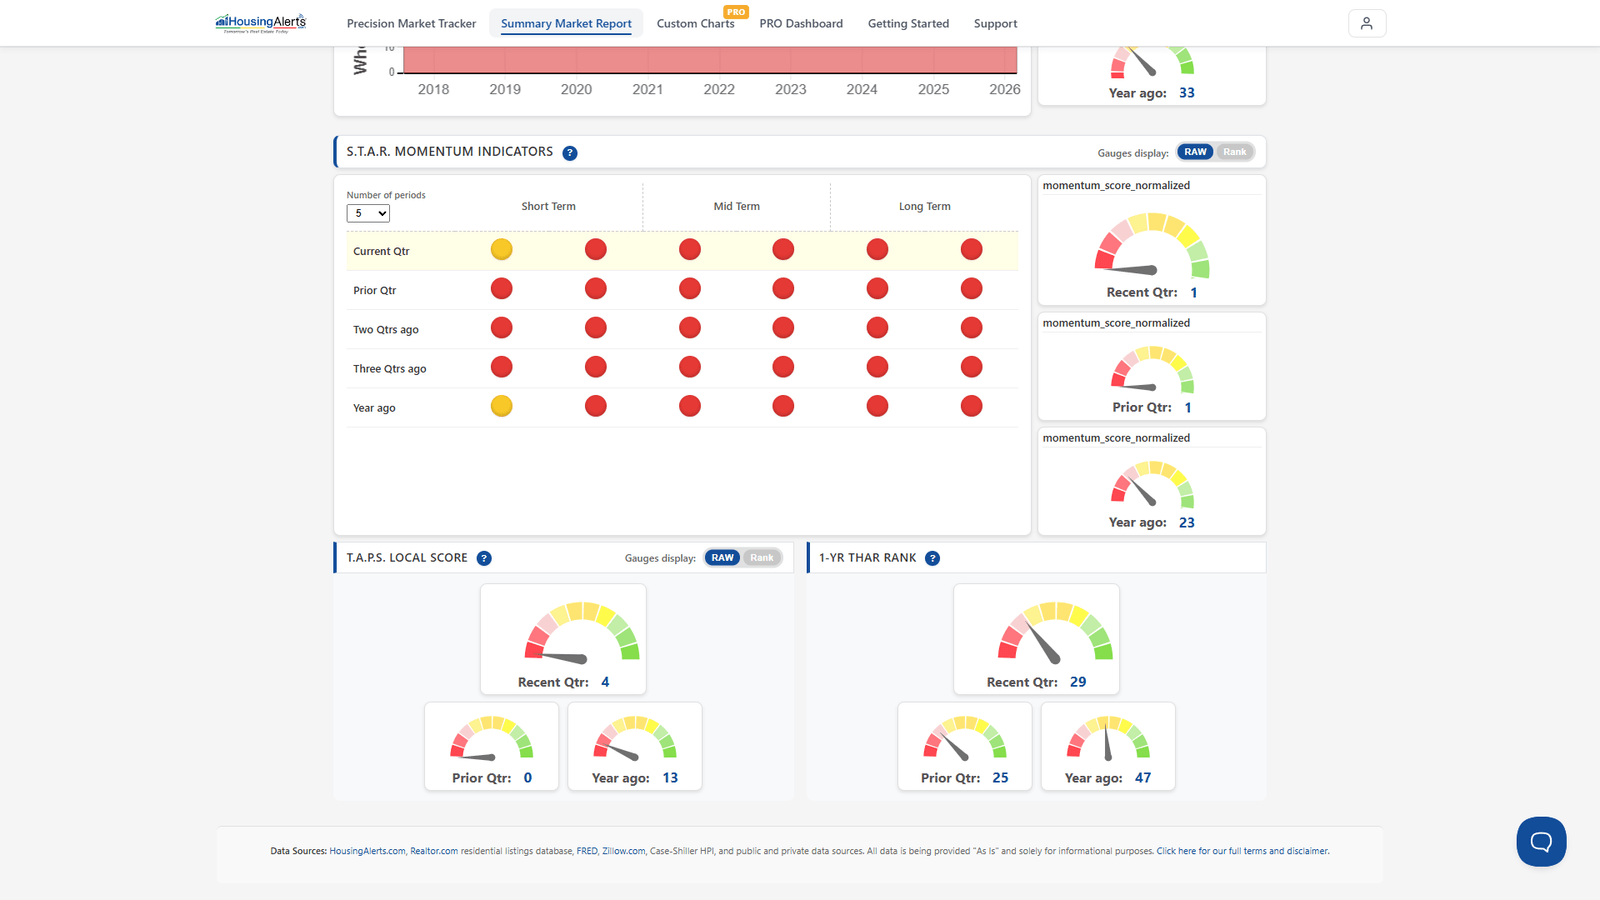
You no longer have to build a special "look over my shoulder" search. The same two dimensions are built into the new platform:
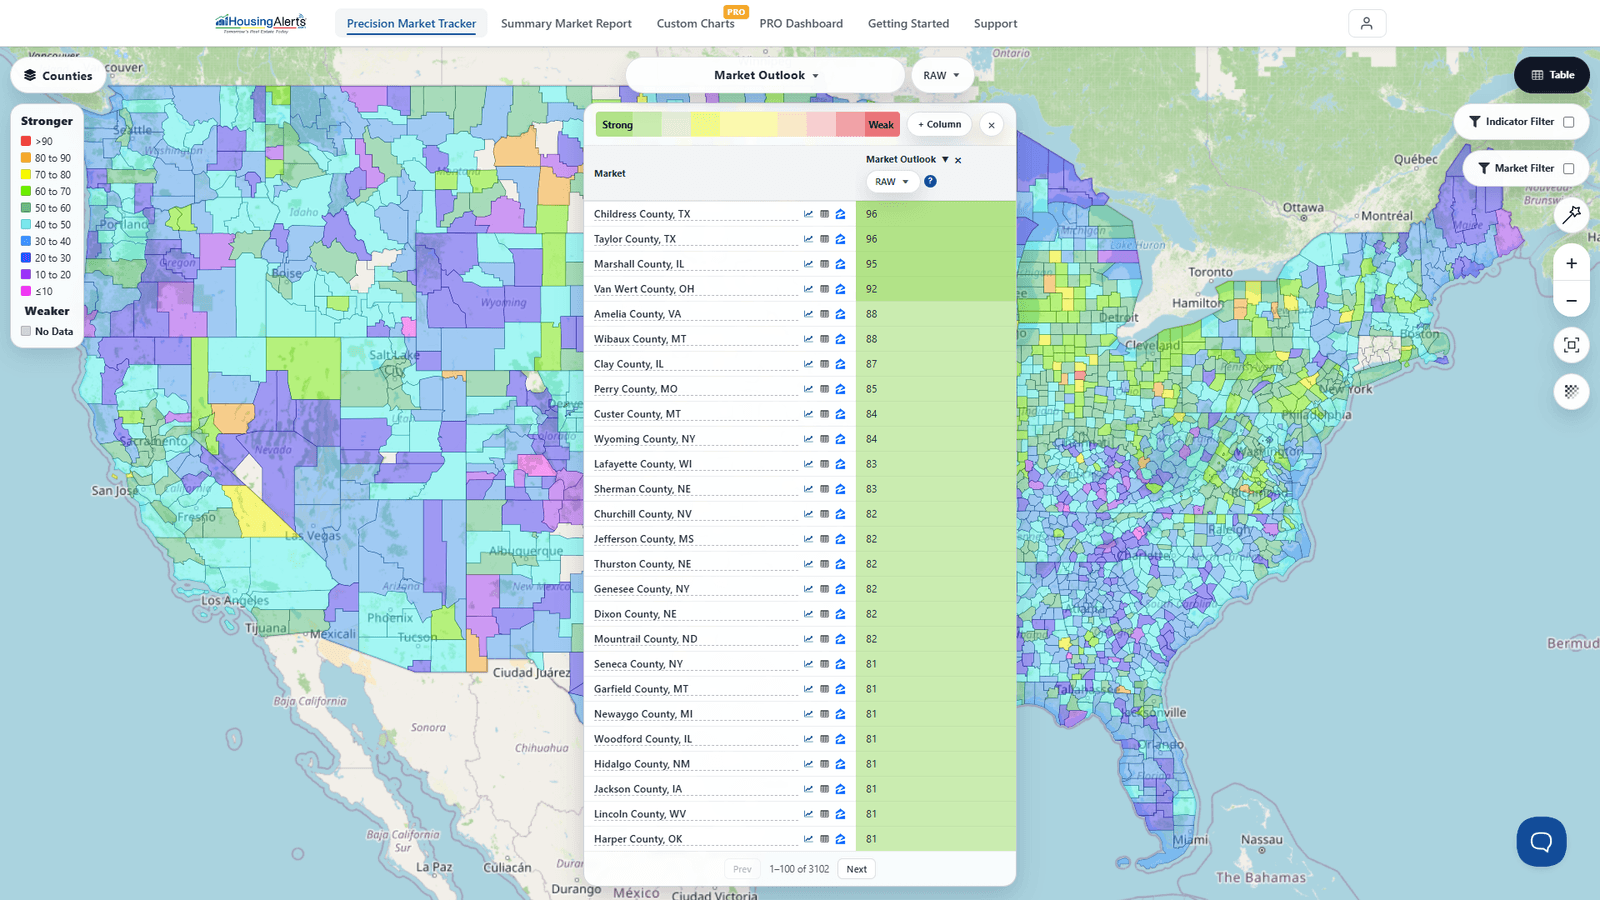
- The Table ranks every market in the country by whatever indicator you choose, best-to-worst, in one click. Sort by the Market Outlook Score to rank on the forward-looking predictor, or by any strategy score.
- The Market Summary Report → Advanced Mode breaks a single market down into its S.T.A.R. Momentum Indicators (Short / Mid / Long Term, shown as Green / Yellow / Red circles across the last five quarters) and its T.A.P.S. Local Score gauges — so you can see strength and momentum side by side before you act.