
The different colors show the energy behind any market. Green means positive, upward-sloping momentum. Red means the opposite. Yellow occurs when, in the current period, the slope/direction changes for that specific trigger.
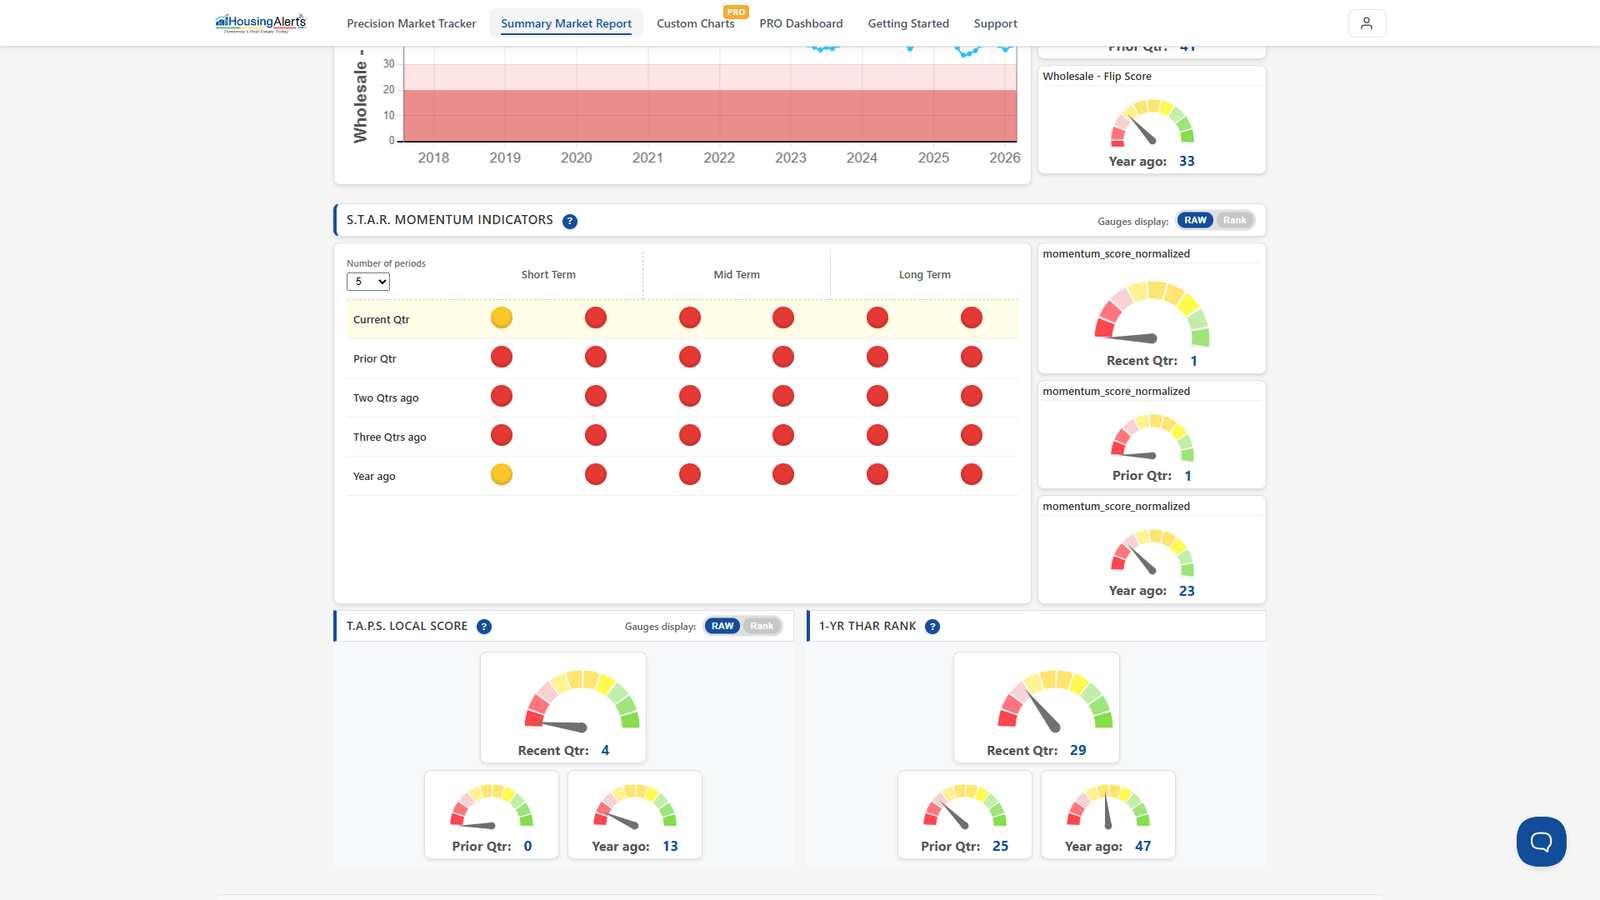
The first step in locating investment candidates is evaluating the S.T.A.R. indicators. Each of the six 'triggers' represents a distinct Technical Analysis (TA) 'event.'
The left-most columns are Short-Term triggers and carry far less significance than the Long-Term indicators on the right. To initiate a new investment, the long-term triggers (at a minimum) should all be green in the current period — provided the T.A.P.S. indicator is showing "strong" (or close to it) and the market is already in a green Wealth Building phase on the Market Summary Report.
That said, all trend reversals (up or down) BEGIN with the short-term triggers — they're early-warning signals, especially when they form a consistent pattern of changing colors (green→red or red→green) 'growing' from left to right. Markets with no consistent one-color pattern — seemingly random horizontal color changes period to period, especially in the long-term triggers — generally lack any momentum and are poor markets for Leveraged Appreciation.
On the new platform, the S.T.A.R. Green/Yellow/Red circles are in the Market Summary Report → Advanced Mode (the S.T.A.R. Momentum Indicators grid, Short/Mid/Long Term across the last five quarters), right beside the T.A.P.S. gauges and the Wealth Phase.