
Question:
What is the 'secret sauce" behind HousingAlerts? Is there a way we can find out what metrics go into the algorithm that ranks these markets as "good" or "bad"?
Answer:
The 'secret' about our secret sauce is that it's really not that secret!
There are two ways to analyze any market — stock, bond, commodity, real estate, currency — by its "Fundamentals" or by its "Technicals." We use Technical Analysis (TA), which has been around for hundreds of years and is used by every global financial firm to drive trillions of dollars in daily trades. Ken has been a TA expert for decades and, combined with a career of commercial, residential, and land investing, was able to "invent" a way to apply TA to local real estate markets.
Unlike the financial markets that change on a dime, real estate is exceptionally cyclical — which makes it relatively easy to use simple TA 'studies' to predict local cycles with astonishing accuracy.
Anyone who understands TA studies would understand what metrics go into the ranking — but there's no way to fully answer that without turning you into a TA expert. The proof of the accuracy is on every page: you can see when the green Wealth Phases begin and end for every market over the last 30–40 years. They're added automatically, in real time — if they were off, you'd see it in the chart, and we don't go back and 'edit' them.
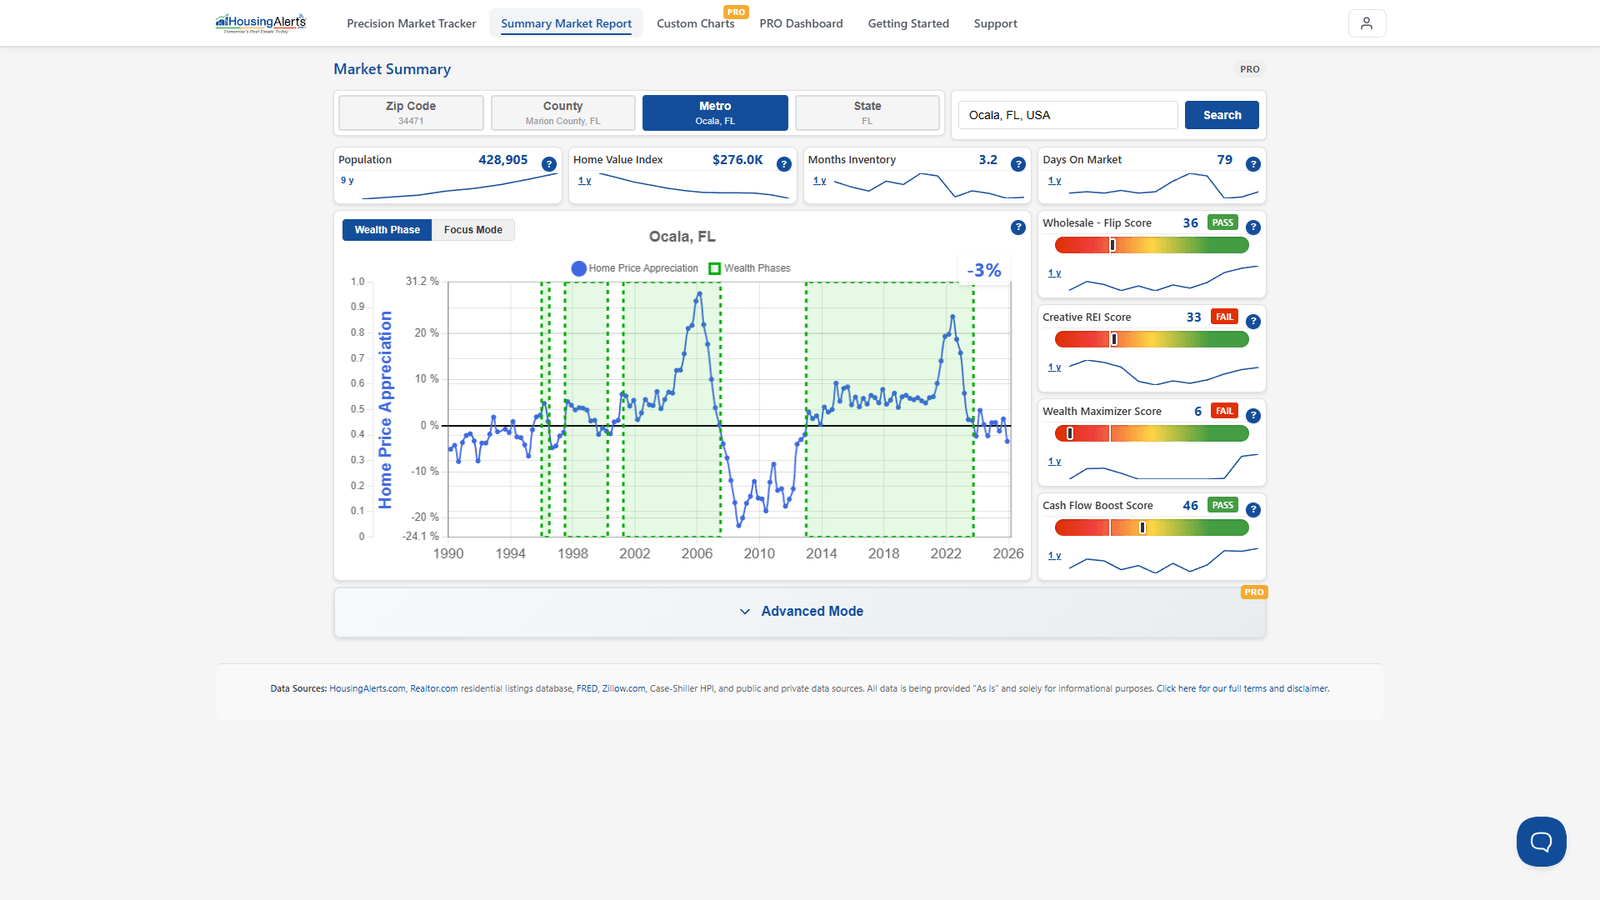
You don't need to be a TA expert to benefit from it. We've worked hard to make it simple — slider balls (T.A.P.S.), color-coded maps, green Wealth Phases, and red/yellow/green (S.T.A.R.) lights. But if you have the time and desire, we'd encourage you to learn more about TA.