
One of our most popular jobs-to-be-done is finding cash flow. In general, higher-cash-flowing properties sit in weaker or flat markets — the higher yield is the reward for taking on more market risk from lower expected appreciation. The old standalone "Cash Flow Finder" combined each market's home value, gross rent yield, and hot-market score into one ranking. On the new platform that logic lives in the Cash Flow Boost strategy score, which you apply and rank right inside the Precision Market Tracker.
What changed: the old Cash Flow Finder (Hot Market Score + Gross Rent Ratio) is now the Cash Flow Boost Score — a strategy score you can rank markets by in The Table and read for any single market in the Market Summary Report. "Save Selection to My Market Tracker" is the legacy watchlist (see Create A Watchlist).
Finding high-cash-flow markets
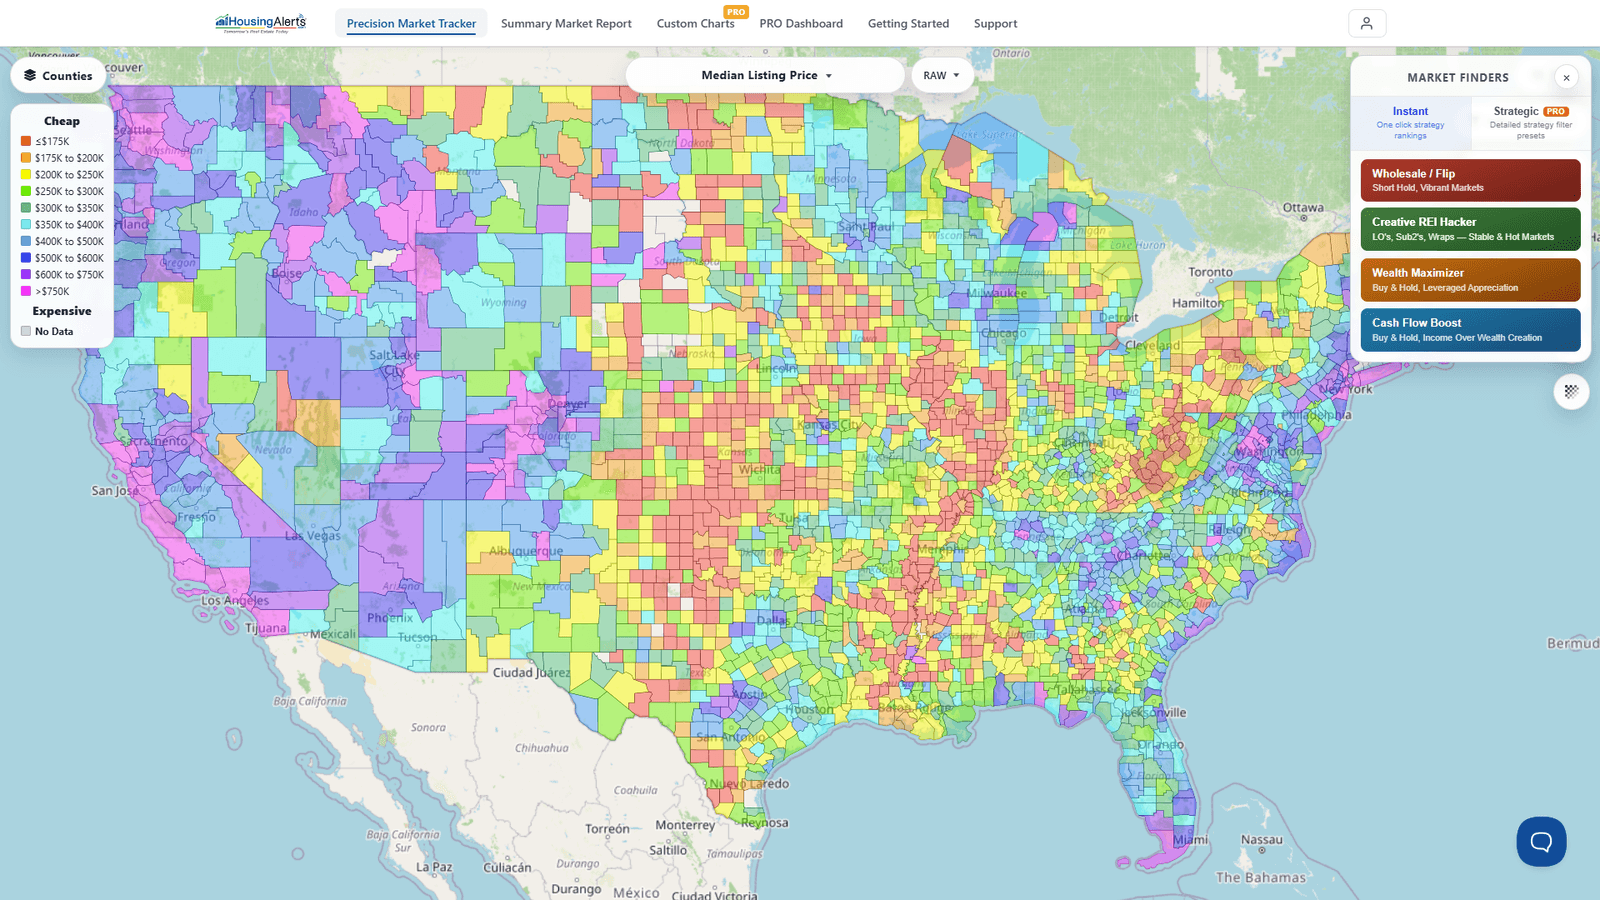
- Open the strategy presets on the Precision Market Tracker and choose the Cash Flow Boost strategy. The map re-ranks and re-scores every market for cash-flow suitability rather than pure appreciation.
- Switch geography level (County or ZIP) to hunt cash flow at the micro-market level, exactly like the old tool let you drill from State down to ZIP.
- Open The Table to see the ranked list, strongest cash-flow markets at the top. Click any column header to sort; the blue arrow reverses the order.
- Click a market's row to Open Full Report and confirm.
Reading cash flow for a single market
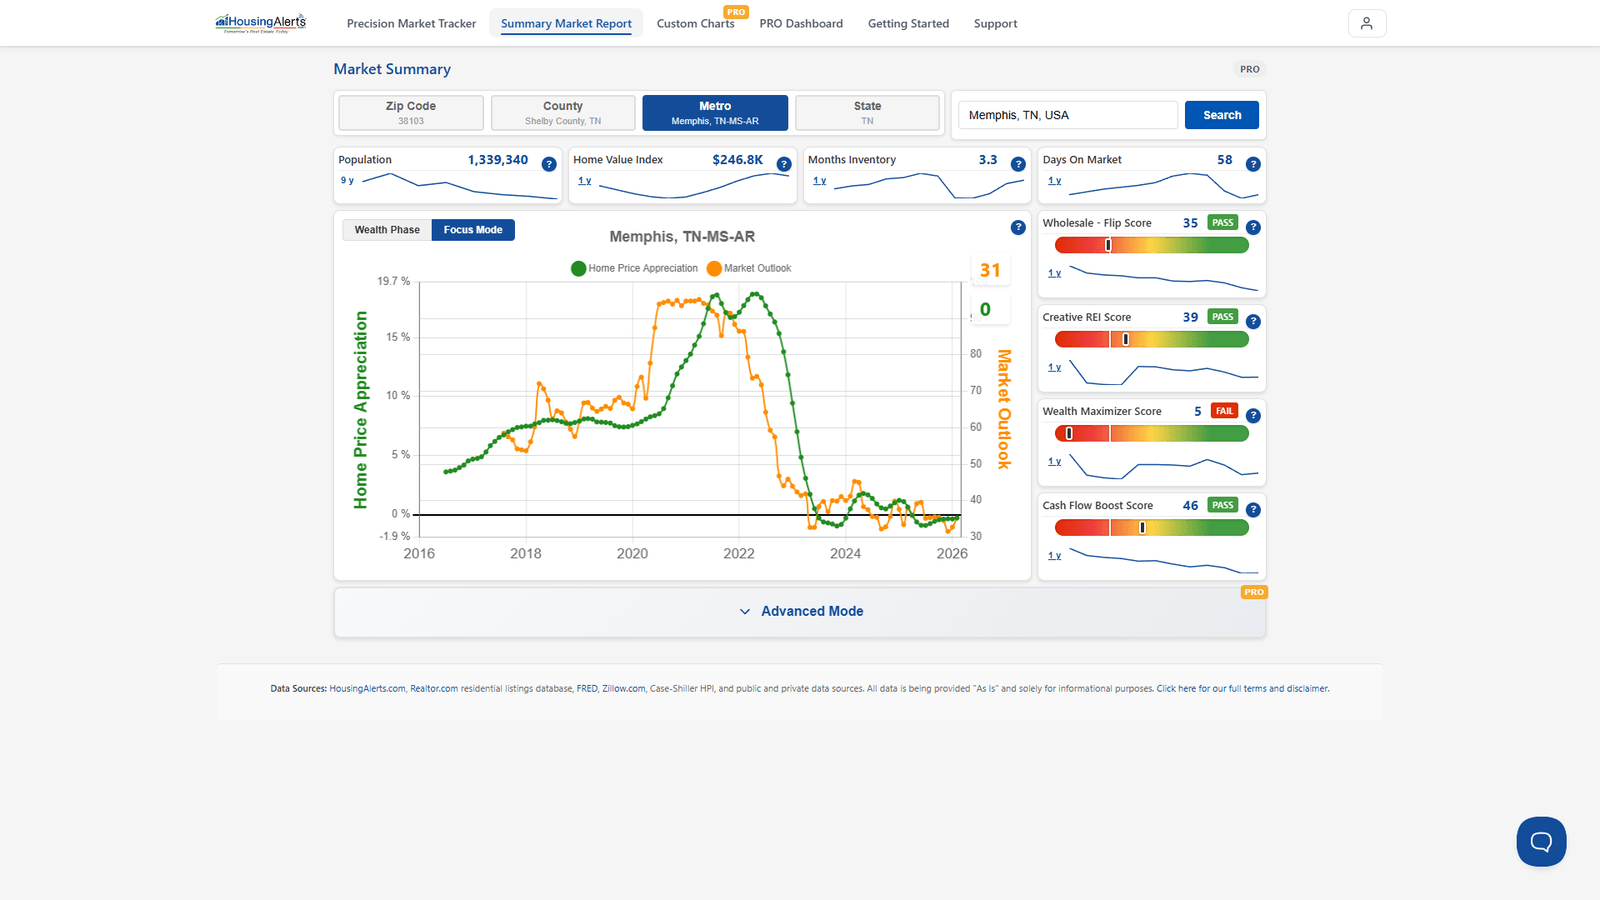
In a market's Market Summary Report, the Cash Flow Boost Score slider shows a PASS / FAIL read for that market's cash-flow suitability, right next to the Home Value Index and the other strategy scores. That combines the same ingredients the old tool exposed as separate columns:
- Home Value — the median value of homes in the market (the old "Median Home Value" column).
- Gross Rent Ratio (concept) — Median Monthly Rent × 12 ÷ Median Home Value. It's a good quick proxy for cash-flow potential. A GRR of 12% is the annual version of the well-known 1% Rule (monthly gross rent ≥ 1% of purchase price).
- Hot-Market strength — the market's appreciation potential (now the Market Outlook Score).
The Cash Flow Boost Score blends value + yield + market strength so you don't have to combine columns by hand. Used together with the Market Outlook Score, it instantly surfaces those 'needle-in-a-haystack' markets that offer BOTH decent cash flow AND some appreciation potential — across every County and ZIP in the country, in a click.