
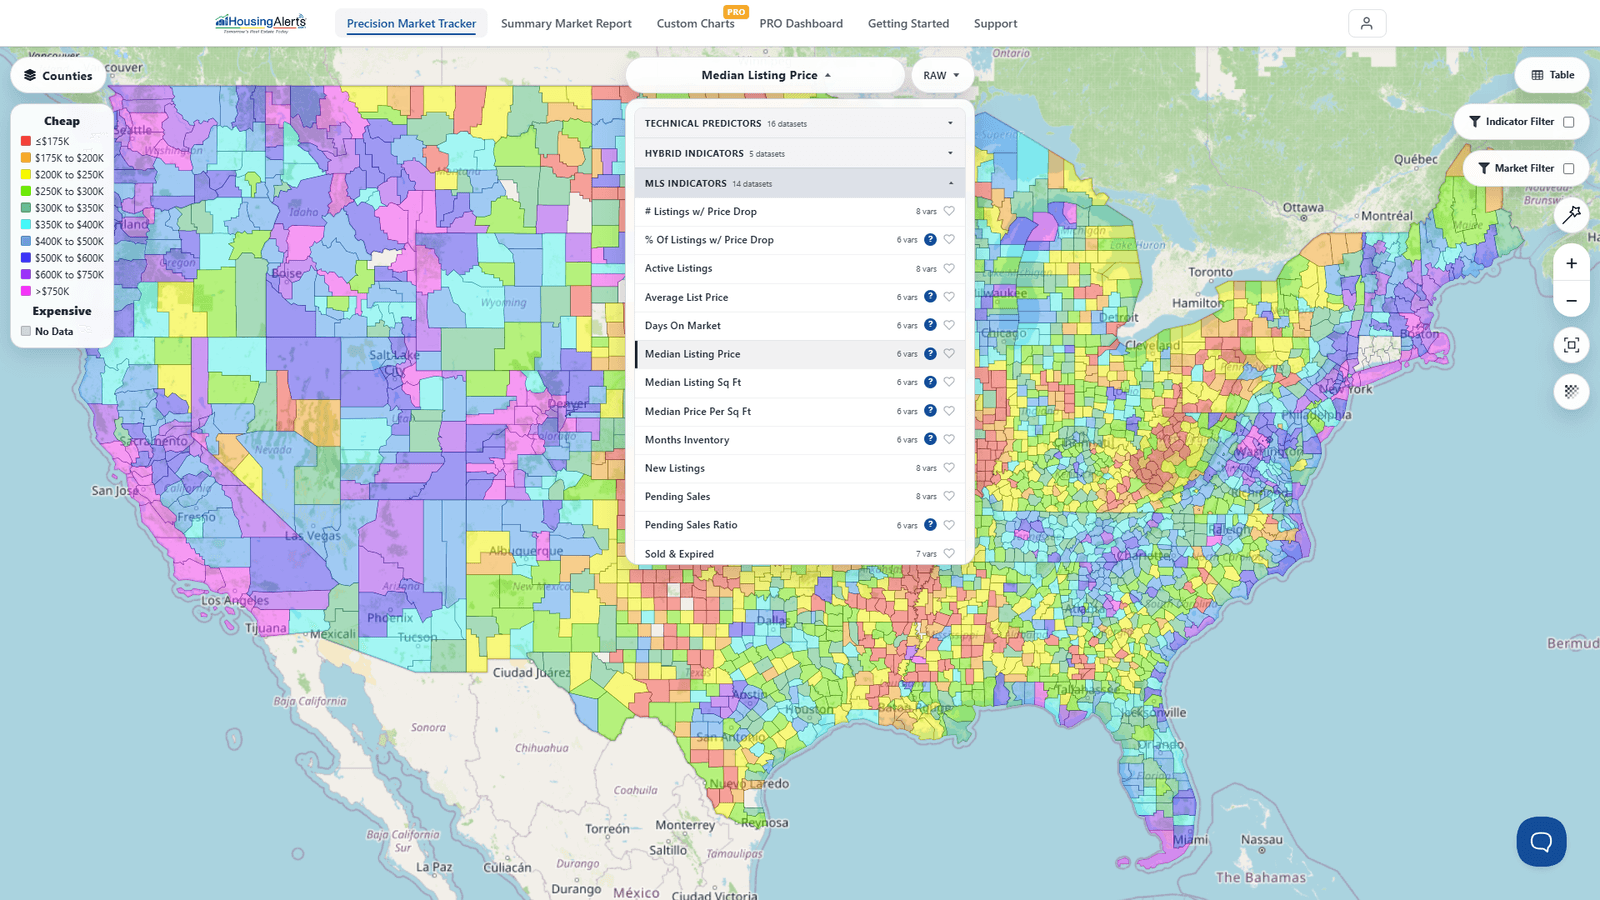
These are the core indicators you can shade the Map by (and rank in The Table) from the dataset picker in the Precision Market Tracker. Most indicators come in two versions:
- RAW — the actual value for that indicator. Raw scores don't rank against other markets; multiple markets can share similar raw scores. When an indicator combines others, its raw value is normalized to a 0 (weakest) – 99 (strongest) scale based on that indicator's historical range.
- PCT (Percentile Rank) — a 0–99 score comparing a market's relative performance against ALL similar U.S. markets. A "93" means the market scored higher than 93% of markets. Useful for relative comparison, not absolute performance.
Color note: on the Map, indicators are shaded on a full best-to-worst spectrum where the warmest colors (toward red) are the strongest markets and the coolest (toward purple/magenta) are the weakest. (Tables and gauges use a separate green/yellow/red traffic-light scheme — see Map vs Gauges & Table Color Schemes.)
Core indicators
- Market Outlook Score (formerly Master Score) — the best single indicator if you only want to look at ONE. A proprietary algorithm that integrates all of our data into a forward-looking score, available as a raw value or a percentile rank.
- T.A.P.S. — Technical Analysis Point Score — the T.A.P.S. ranking after combining the local (city-level) market with its State, Regional, and National T.A.P.S. scores. Higher = stronger market strength.
- S.T.A.R. — Market Momentum — the S.T.A.R. indicators show the 'energy' behind a market. A sustained up-cycle MUST be supported by momentum. Market Psychology influences momentum but isn't the only driver. Higher = stronger momentum.
- Home Value Index / Median Home Value — the estimated median value of all Single-Family Residential (SFR) homes in that market.
- Annual Rent Growth (e.g. 3-yr CAGR) — the annual % increase/decrease in the median rent for the median SFR over a period. The CAGR smooths out noise in small-sample micro-markets to show truer relative performance.
- Gross Rent Ratio — a proxy for cash-flow potential; a higher score means SFR rents have risen more in this market relative to all markets nationwide.
- Hot Market + Cash Flow (now the Cash Flow Boost Score) — combines a micro-market's cash-flow potential (median rent ÷ median home value, ranked nationwide) with its appreciation potential (the hot-market/Market Outlook rank).
- Annual Home Price Appreciation (HPA) — the increase in a home's value over time, based on the fair-market value of comparable homes. Also offered as 2-yr / 3-yr CAGR (smoothed) and Inflation-Adjusted variants.
- Quarterly HPA (annualized) — the change in home prices from three months earlier, annualized (×4). Quarterly data carries more noise but spots reversals faster than annual data.