
The T.A.P.S. (Technical Analysis Point Score) indicator is an easy-to-understand, graphical way to show the results of complex Technical Analysis (TA) "Studies."
The simple 'slider ball' can move a total of five notches, from far left (Weak) to far right (Strong). If the ball has moved since the prior period, it shows a series of arrows behind it: arrows pointing from the left mean it moved from weaker toward stronger, and vice-versa.
Each detailed TA Study has its own slider-ball indicator, made up of dozens to hundreds of individual calculations (collectively, the 'algorithms'). Those detailed algorithms are aggregated and weighted into higher-level summary sliders, all the way up to the top-level overall score. These proprietary T.A.P.S. scores are then ranked against other markets to optimize your opportunity cost and investment success — and merged with the Momentum (S.T.A.R.) studies to produce the local real estate market-cycle system.
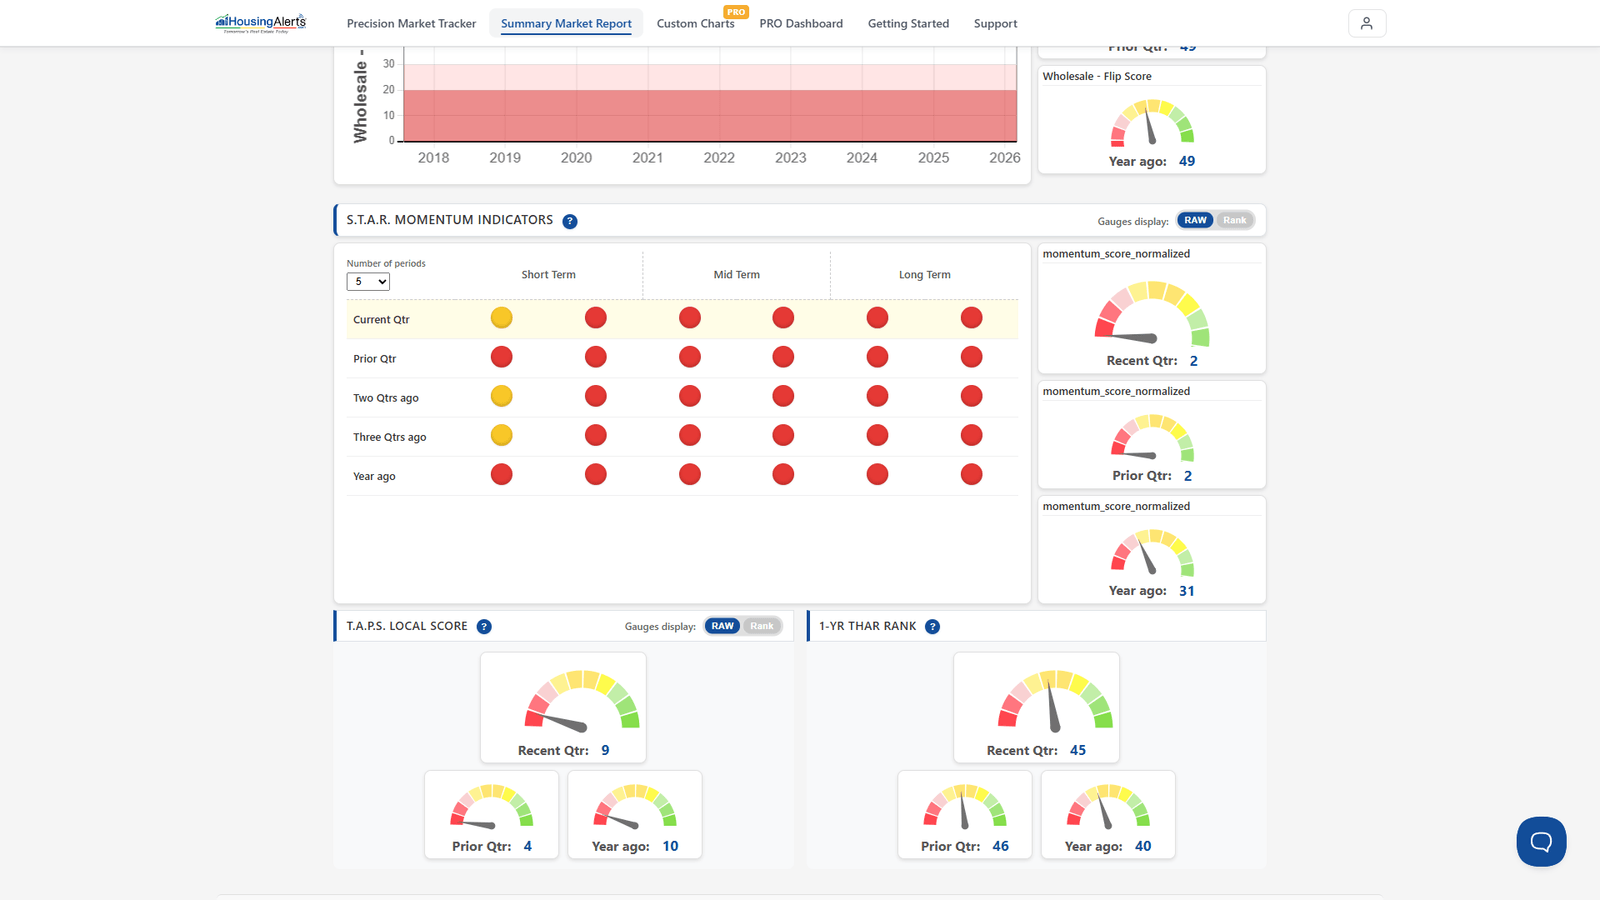
On the new platform, the T.A.P.S. sliders appear in the Market Summary Report → Advanced Mode (the T.A.P.S. Local Score gauges), alongside the S.T.A.R. Momentum grid. For more, visit the free Video Training section — see the S.T.A.R. & T.A.P.S. tutorial.