Question:
Is the slider on the STAR "Market Finder" results drawing from the same data as the 6 Triggers which display as red, green or yellow circles to the right of the slider?
Answer:
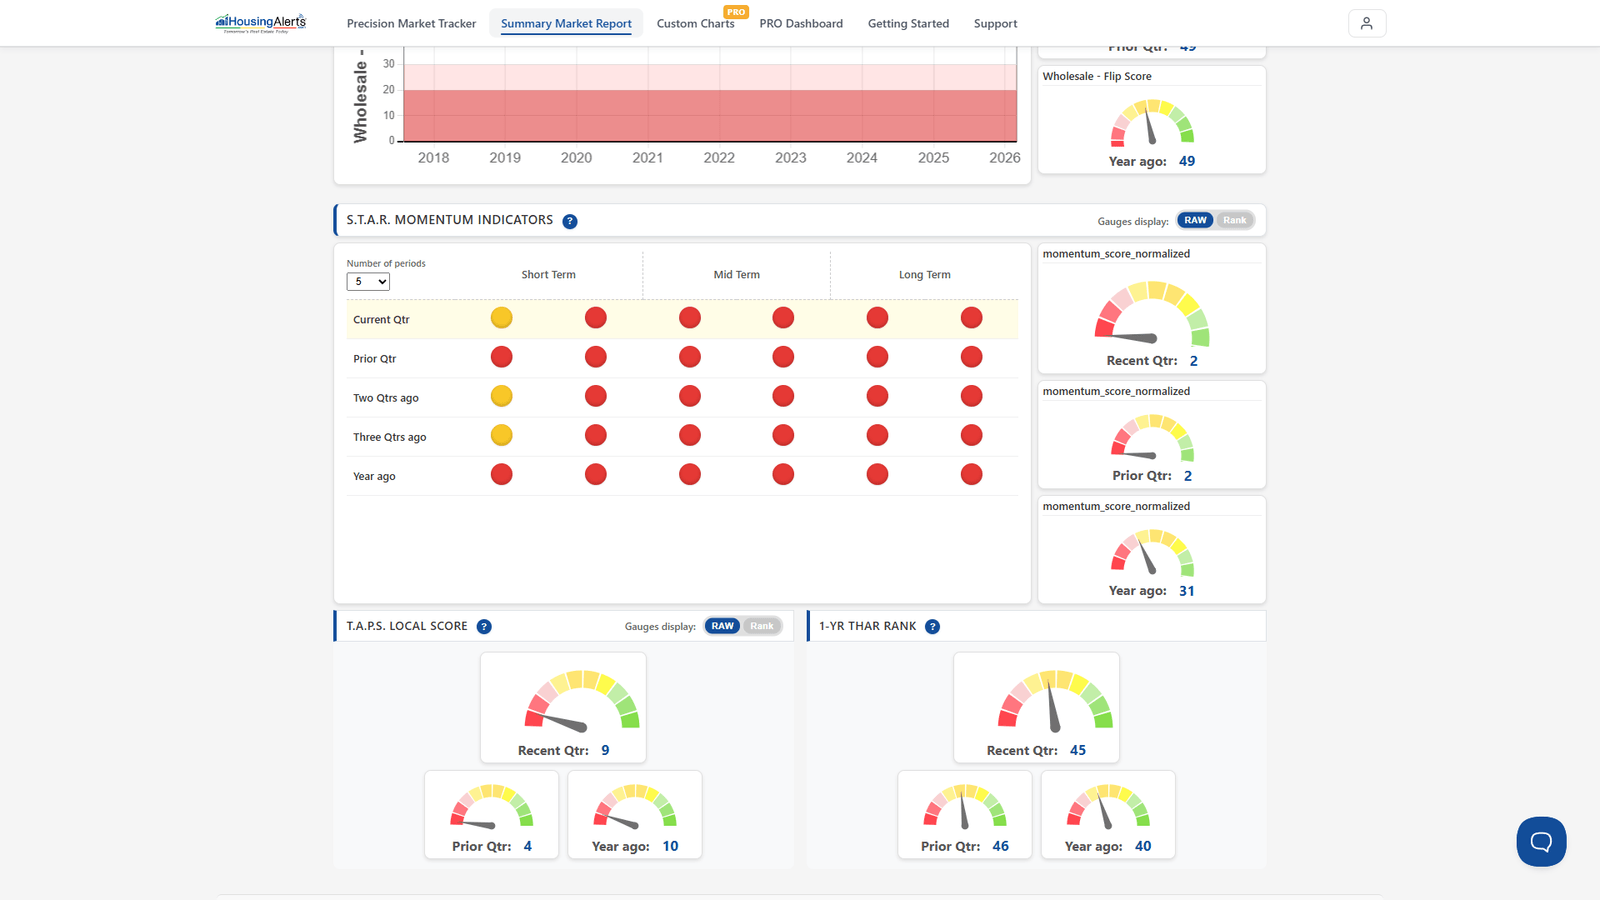
NO — the T.A.P.S. score (the slider) has nothing to do with the red/yellow/green S.T.A.R. momentum indicators (the circles). They're two entirely different sets of algorithms measuring two different things:
- T.A.P.S. slider = the market's underlying strength (Technical Analysis Point Score).
- S.T.A.R. circles = the market's momentum / direction (the six triggers).
On the new platform you'll find both, side by side, in the Market Summary Report → Advanced Mode — the S.T.A.R. Momentum grid of Green/Yellow/Red circles and the T.A.P.S. Local Score gauges. Read them together: strength and momentum. For a deeper walkthrough, see the S.T.A.R. & T.A.P.S. tutorial in the free Video Training section.