What’s the difference between HousingAlerts PRO and the new Precision Market Tracker?
HousingAlerts PRO: Built for the proactive, generational wealth-seeking investor who wants every competitive advantage to leapfrog over their competition.
Precision Market Tracker (PMT): The budget-friendly option for investors who want to invest intelligently, find winning markets fast, and avoid getting clobbered.
Free MLS Account: If you’re just getting started, our free account gives you access to 14 core MLS market activity indicators to explore the data right away.
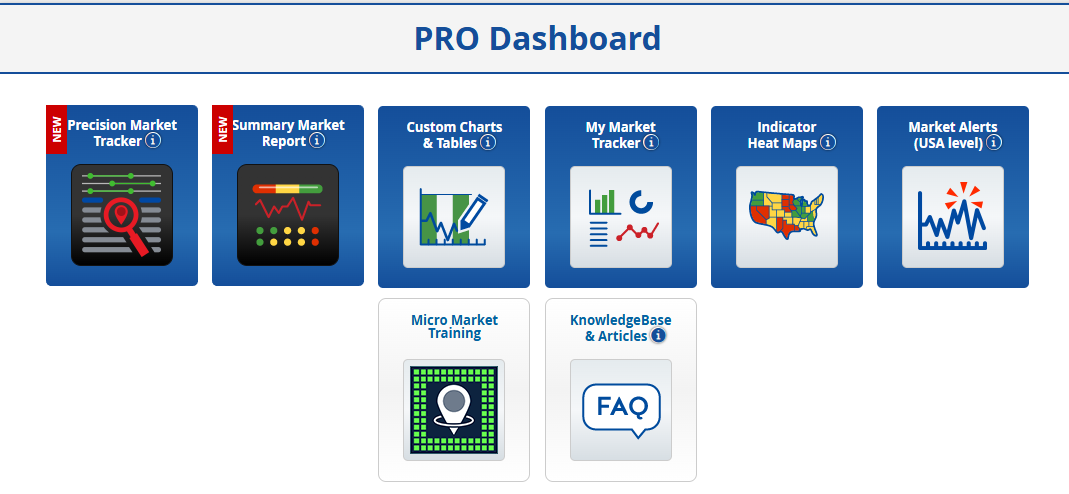
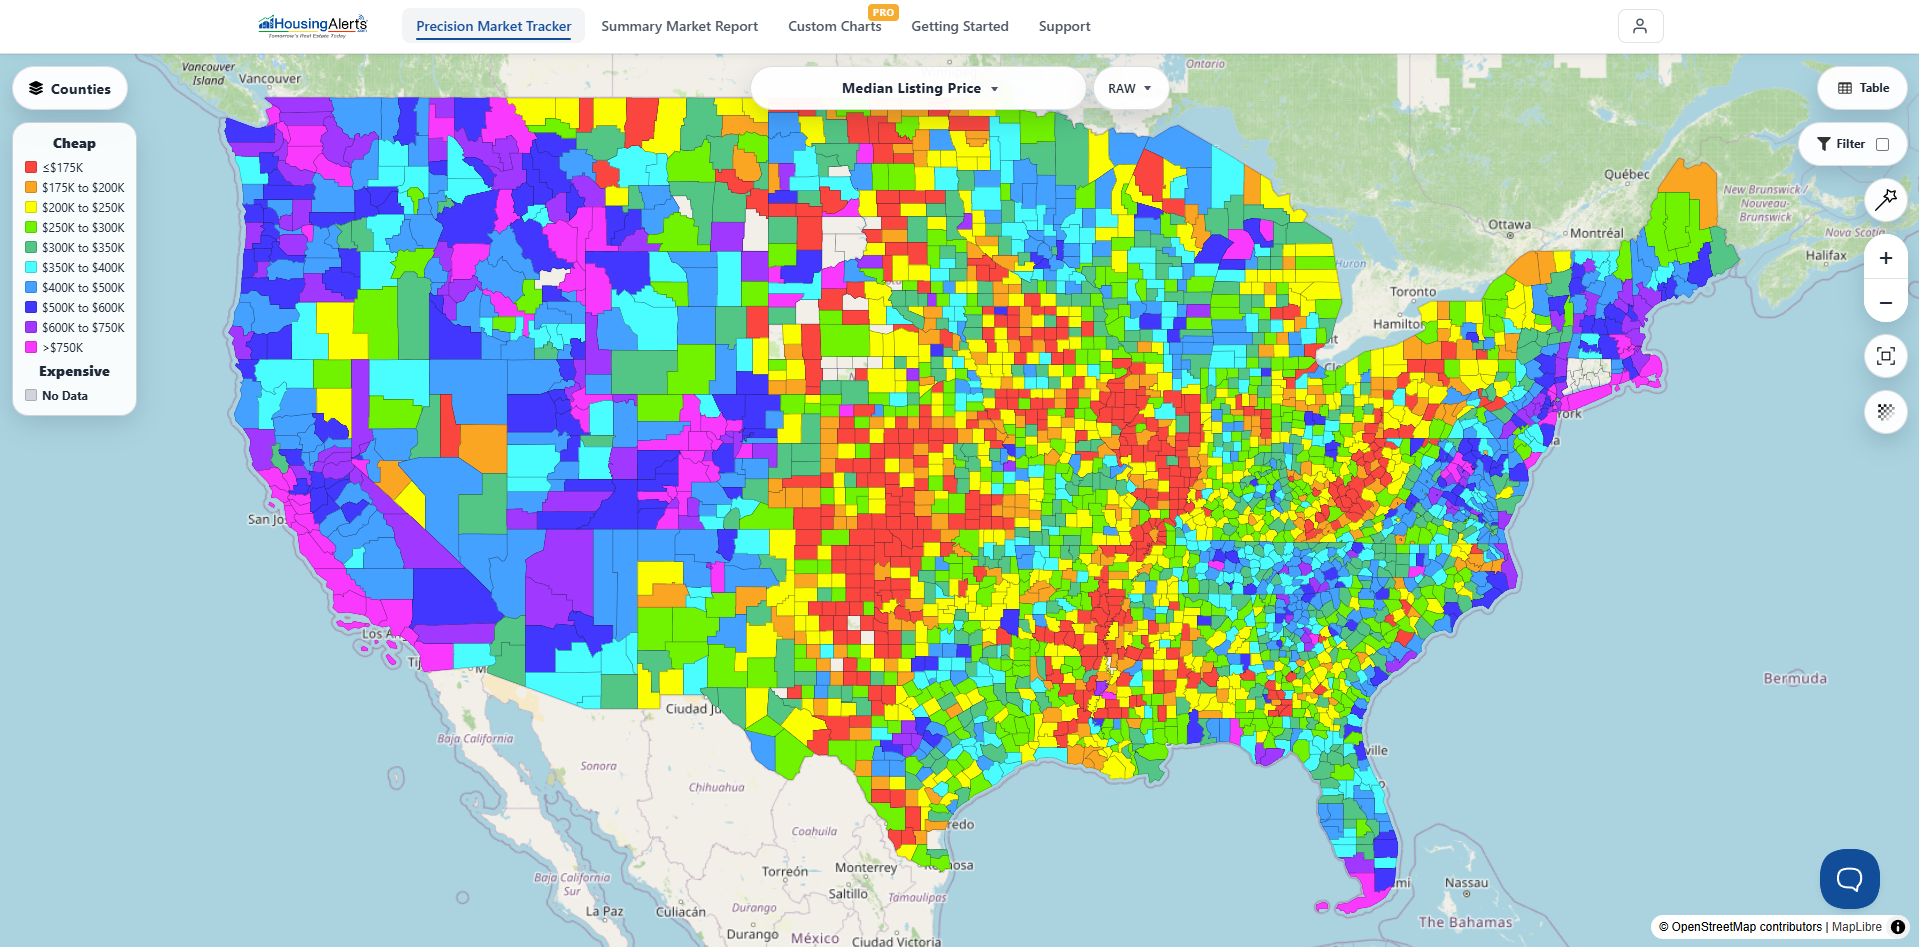
Here Are The Most Notable Differences
A side-by-side breakdown of tools, indicators, and access levels across all three plans.
| Features | PRO | PMT | Free MLS Account |
|---|---|---|---|
| Grandfathered Pricing (Your Rate Will Never Go Up!) | ✔ | ✔ | Free Forever |
| World Class Customer Support | ✔ | ✔ | ✔ |
| Cancel any time | ✔ | ✔ | It’s Free! |
| Multiple Metro – State – Region Options | ✔ | ✔ | Free Nationwide |
| Unlimited Simultaneous Indicators | ✔ | ✔ | ✘ |
| Number of Indicators | 176 | 115 | 54 |
| Technical Predictors | 38 | 28 | ✘ |
| Hybrid Indicators | 10 | 5 | ✘ |
| MLS Indicators | 95 | 61 | 53 |
| Appreciation Indicators | 20 | 14 | ✘ |
| Fundamental Metrics | 13 | 7 | 1 |
| Full Mapping of Over 100 Indicators | ✔ | ✘ | ✘ |
| Customizable Mapping Indicators | ✔ | ✔ | ✘ |
| Custom Charting | ✔ | ✘ | ✘ |
| Strategic Market Scanners (Strategy Buttons) | ✔ | ✔ | ✘ |
| Wholesale – Flip | ✔ | ✔ | ✘ |
| Creative REI Hacker | ✔ | ✔ | ✘ |
| Cash Flow Boost | ✔ | ✔ | ✘ |
| Wealth Maximizer | ✔ | ✔ | ✘ |
| All Future NEW Tools & Innovation | ✔ | ✘ | ✘ |
| Saved Filters | ✔ | ✔ | ✔ |
| My Market Tracker | ✔ | ✘ | ✘ |
Ready to Invest Intelligently?
Choose HousingAlerts “PRO” or Precision Market Tracker “PMT” Below:
(Billed Annually – Cancel Anytime)Indicator Access Comparison
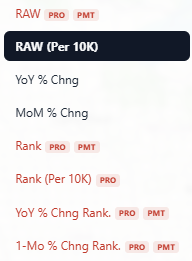
Most PRO level indicators include different versions for each indicator, such as Raw, Rank, YoY, MoM and 1-Yr change. Most PMT indicators generally include Raw & YoY Change versions for each indicator.
| Indicators | PRO | PMT | Free MLS Account |
|---|---|---|---|
| Technical Predictors | |||
| Wealth Phase (Metro & State) | ✔ | ✔ | ✘ |
| Market Outlook | ✔ | ✔ | ✘ |
| Momentum Alert (Metro & State) | ✔ | ✔ | ✘ |
| Stability Index | ✔ | ✘ | ✘ |
| Wholesale – Flip Score | ✔ | ✔ | ✘ |
| Creative REI Score | ✔ | ✔ | ✘ |
| Cash Flow Boost Score | ✔ | ✔ | ✘ |
| Wealth Maximizer Score | ✔ | ✔ | ✘ |
| CRE (Multi-Family) Score | ✔ | ✔ | ✘ |
| State & Metro Forecast | ✔ | ✘ | ✘ |
| S.T.A.R. Momentum (Metro & State) | ✔ | ✔ | ✘ |
| T.A.P.S. Local Score (Metro & State) | ✔ | ✔ | ✘ |
| STAR Indicator #3 (Metro & State) | ✔ | ✘ | ✘ |
| STAR Indicator #4 (Metro & State) | ✔ | ✘ | ✘ |
| STAR Indicator #5 (Metro & State) | ✔ | ✘ | ✘ |
| STAR Indicator #6 (Metro & State) | ✔ | ✘ | ✘ |
| Hybrid Indicators | |||
| Gross Rent Ratio | ✔ | ✔ | ✘ |
| Market Outlook + Cash Flow (Rank) | ✔ | ✔ | ✘ |
| Market Outlook + House Value (Rank) | ✔ | ✔ | ✘ |
| Value to Income Ratio | ✔ | ✔ | ✘ |
| Affordability Ratio | ✔ | ✔ | ✘ |
| MLS Indicators | |||
| Months Inventory | ✔ | ✔ | ✔ |
| Median Listing Price | ✔ | ✔ | ✔ |
| Median Price Per Sq Ft | ✔ | ✔ | ✔ |
| Median Listing Sq Ft | ✔ | ✔ | ✔ |
| Average List Price | ✔ | ✔ | ✔ |
| Days On Market | ✔ | ✔ | ✔ |
| % Of Listings w/ Price Drop | ✔ | ✔ | ✔ |
| Pending Sales Ratio | ✔ | ✔ | ✔ |
| Pending Sales | ✔ | ✔ | ✔ |
| Total Listings | ✔ | ✔ | ✔ |
| Active Listings | ✔ | ✔ | ✔ |
| New Listings | ✔ | ✔ | ✔ |
| Sold & Expired | ✔ | ✔ | ✔ |
| # Listings w/ Price Drop | ✔ | ✔ | ✔ |
| Appreciation Rates | |||
| Annual Home Price Appreciation (%) (Metro & State) | ✔ | ✔ | ✘ |
| Inflation Adjusted Annual HPA (%) (Metro & State) | ✔ | ✔ | ✘ |
| Quarterly Home Price Appreciation (annualized %) (Metro & State) | ✔ | ✔ | ✘ |
| Inflation Adj. Quarterly HPA (%) (Metro & State) | ✔ | ✔ | ✘ |
| Zillow Home Value Index (ZHVI) | ✔ | ✔ | ✘ |
| Annual HPA (%) – 2 yr. CAGR (Metro & State) | ✔ | ✘ | ✘ |
| Annual HPA (%) – 3 yr. CAGR (Metro & State) | ✔ | ✘ | ✘ |
| Annual HPA (%) – 5 yr. CAGR (Metro & State) | ✔ | ✘ | ✘ |
| Fundamental Metrics | |||
| Population | ✔ | ✔ | ✔ |
| Median Household Income | ✔ | ✔ | ✘ |
| Median Rent | ✔ | ✔ | ✘ |
| Median Home Value | ✔ | ✔ | ✘ |
Ready to Invest Intelligently?
Choose HousingAlerts “PRO” or Precision Market Tracker “PMT” Below:
(Billed Annually – Cancel Anytime)Reports
| Reports | PRO | PMT | Free MLS Account |
|---|---|---|---|
| Summary Market Scoring ReportComplete city level market analysis, scoring & ranking on one page. | ✔ | ✔ | ✘ |
| Summary Market Report – StateAnalyze, score & rank each state based on 12 critical indicators. | ✔ | ✔ | ✘ |
| Market Alerts (USA level)Get alerts for local markets entering or leaving Wealth Phases & major changes in their Market Outlook. | ✔ | ✘ | ✘ |
| My Market TrackerTrack your markets at a glance by saving them to your watchlist. | ✔ | ✘ | ✘ |
| Custom Charts & TablesCreate, chart, compare & analyze multiple macro and micro markets with custom indicators & time periods. | ✔ | ✘ | ✘ |
| National Market OverviewU.S. overall real estate market analysis, scores & indicators. | ✔ | ✘ | ✘ |
| Best & Worst StatesBest & worst REI investing states (ranked by momentum & technicals). | ✔ | ✘ | ✘ |
| Best & Worst RegionsBest & worst real estate investing regions. | ✔ | ✘ | ✘ |
| Summary Market Report – RegionAnalyze, score & rank each region based on 8 critical indicators. | ✔ | ✘ | ✘ |
| Monthly Regional AnalysisKeep monthly tabs on all regions to spot early rising or falling market signals. | ✔ | ✘ | ✘ |
| Advance-Decline IndicatorMacro trend analysis based on advancing vs. declining markets. | ✔ | ✘ | ✘ |
Market Finder Tools
| Market Finder | PRO | PMT | Free MLS Account |
|---|---|---|---|
| Precision Market FinderAdvanced Market Insights with Custom Predictive Indicators & Maps. | ✔ | ✔ | ✘ |
| Hot Market FinderRank all Metro markets (best to worst) by variety of indicators. | ✔ | ✘ | ✘ |
| Micro Market RankingsScore, filter and rank county, zip code and neighborhood markets (best to worst). | ✔ | ✘ | ✘ |
| Cash Flow FinderScore, filter and rank state, metro, and micro markets for best cash flow AND appreciation markets. | ✔ | ✔ | ✘ |
| House Value FinderScore, filter and rank state, metro, and micro markets based on home prices and market strength. | ✔ | ✘ | ✘ |
| Rent Growth TrackerScore, filter and rank state, metro, and micro markets based on best/worst rental growth markets. | ✔ | ✘ | ✘ |
| State Market RadarCompare multiple indicators and rank all states’ performance over time. | ✔ | ✘ | ✘ |
| Dynamic State TablesQuick sort, rank and filter state-level real estate appreciation. | ✔ | ✘ | ✘ |
| Regional Market RadarCompare multiple indicators and rank all regions’ performance over time. | ✔ | ✘ | ✘ |
| Cash Flow Market RankingsEarly identification of cash flow + appreciation market trends. | ✔ | ✘ | ✘ |
| Scan & Rank Local MarketsCustom filter, rank and list metro markets’ appreciation for any time periods. | ✔ | ✘ | ✘ |
| Six Trigger Alert Report (STAR)Rank, list & filter metro markets based on their STAR momentum score for early trend signals. | ✔ | ✘ | ✘ |
Other Tools & Resources
| Other Tools | PRO | PMT | Free MLS Account |
|---|---|---|---|
| Sensitivity AnalysisKnow your ‘real’ risks and upside. | ✔ | ✘ | ✘ |
| MicroMarket Training21 video Local Market Mastery Training Program. | ✔ | ✘ | ✘ |
| Getting Started GuideQuick tips, articles and FAQs to get up and running fast. | ✔ | ✔ | ✘ |
| KnowledgeBase & Support System100+ searchable Q & A articles answering members’ questions. | ✔ | ✔ | ✘ |
Ready to Invest Intelligently?
Choose HousingAlerts “PRO” or Precision Market Tracker “PMT” Below:
(Billed Annually – Cancel Anytime)